
Air Quality in Alberta
Air quality index (AQI⁺) and PM2.5 air pollution in Alberta •
Live Air Quality Ratings in Alberta
Live city rankings are temporarily unavailable.
The Right Air Filter For High AQI Days
When outdoor air quality drops, the EPA recommends upgrading to a MERV 13 filter — or the highest-rated filter your HVAC system can handle — to help capture more of the fine particulate (PM2.5) that comes with poor air quality. MERV 13 is the highest rating most residential systems can run without restricting airflow.
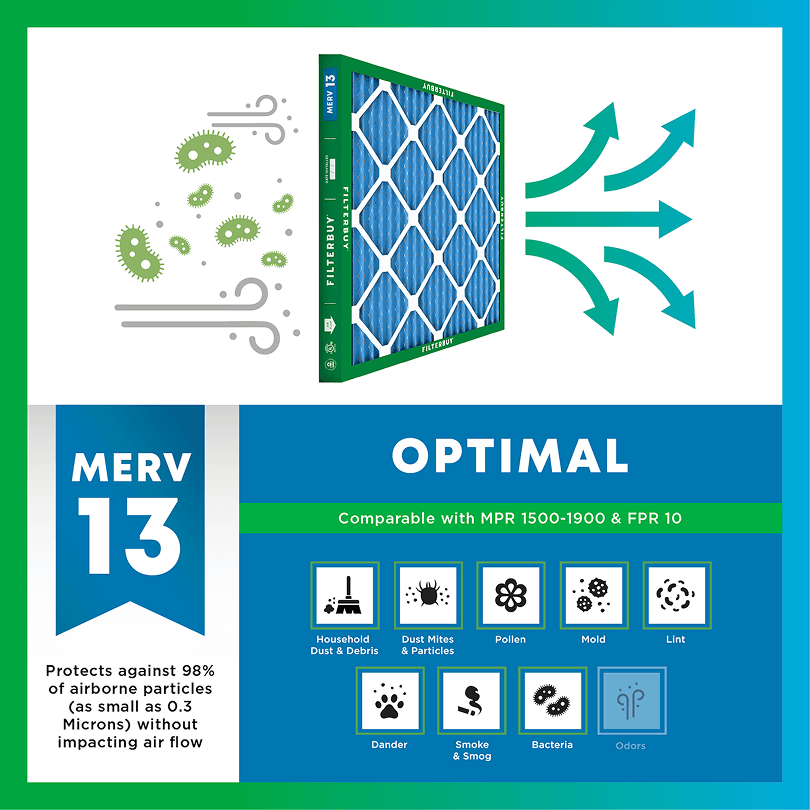
- Captures PM2.5 and other fine particulates
- Filters ash, soot, and smoke particles
- Rated to capture particles as small as 0.3 microns
- Matches the filter rating the EPA suggests during high-AQI and smoke events

AQI FAQs
What is AQI?
AQI stands for Air Quality Index, the EPA's scale for reporting daily air quality. It runs from 0 to 500. The higher the number, the greater the level of air pollution. Values at or below 100 are generally considered satisfactory; values above 100 mean air quality is unhealthy, first for sensitive groups, then for everyone as numbers climb.
What does AQI measure?
The AQI tracks five major pollutants regulated by the Clean Air Act: ground-level ozone, particle pollution (PM2.5 and PM10), carbon monoxide, sulfur dioxide, and nitrogen dioxide. The reported AQI value reflects whichever pollutant is highest at that time — most often ozone or fine particles (PM2.5).
How is AQI calculated?
Monitoring stations measure pollutant concentrations, and the EPA converts each into a standardized 0–500 score using set breakpoints. Each pollutant gets its own sub-index, and the highest sub-index becomes the reported AQI. That's why a single number can represent different pollutants on different days.
What is a good AQI?
An AQI of 0–50 is rated "Good" — air quality poses little or no risk. 51–100 is "Moderate," acceptable for most people though unusually sensitive individuals may want to limit prolonged outdoor exertion. Anything at or below 100 is generally considered satisfactory air quality.
What does an AQI of 100 (or 150) mean?
100 is the dividing line: at or below it, air quality is satisfactory for the general public. From 101–150, air is "Unhealthy for Sensitive Groups" — people with respiratory conditions, older adults, and children. From 151–200, it's "Unhealthy" and everyone may begin to feel effects.
Why is the AQI bad today?
Short-term AQI spikes usually come from wildfire smoke, temperature inversions that trap pollutants near the ground, high-ozone weather (hot, sunny, stagnant days), or heavy traffic and industrial activity. Check a real-time source like the map on this page to see which pollutant is driving today's reading in your area.
What AQI is bad for running or exercise?
Many runners follow the EPA category lines: below 50, no adjustment needed; 51–100, unusually sensitive people may shorten intense workouts; above 100, sensitive groups are advised to reduce prolonged or heavy outdoor exertion; above 150, that advice extends to everyone. Exercise increases how much air you breathe in, which is why thresholds matter more during workouts.
What AQI is safe to open windows?
A common rule of thumb is to keep windows open when the AQI is under 100 and close them when it climbs above, especially during wildfire smoke events when fine particles are elevated. When windows are closed, running your HVAC system with a fresh filter helps capture particles circulating indoors.
Should I wear a mask based on AQI?
Public health agencies generally suggest considering a well-fitted N95-style respirator outdoors when the AQI exceeds 150, particularly during smoke events. Cloth and surgical masks don't filter fine particles effectively. Follow guidance from your local health department, which may adjust recommendations during severe episodes.
Check Today’s Live Real Time Air Quality Index AQI Map in Alberta Now
The map above refreshes every hour, so what you’re seeing is the air outside your door right now, not yesterday’s average. Find your city, from Edmonton to Lethbridge to Fort McMurray, and you’ll know in seconds whether it’s a windows-open kind of day or a keep-them-shut one.
Alberta’s air can turn on a dime. A clear Chinook morning in Calgary can give way to thick haze by afternoon as wildfire smoke drifts down from the north, sometimes from a fire you didn’t even know was burning. So this page keeps things simple. It shows current conditions on a map you can read at a glance, then explains what those numbers actually mean, calmly and without scare tactics. And if today happens to be a smoky one, we’ll walk you through a few easy ways to keep the air inside your home fresh. No panic. Just straight answers from people who think about indoor air all day. For the bigger picture, you can also see air quality across Canada.
TL;DR: Quick Answers
Want today’s air? Use the live map at the top. Find your city, read the number. Updated hourly.
Is it bad? Good or Low-risk means clean. Unhealthy or High-risk usually means wildfire smoke or a winter inversion, so stay in and filter the air.
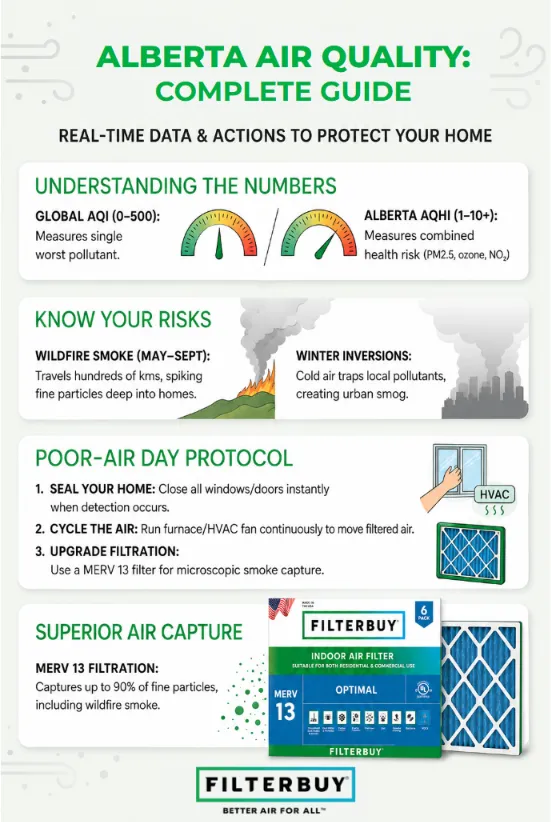
AQI or AQHI? Alberta’s airsheds report the AQHI (1–10+). Global apps show AQI (0–500). Higher means more care for both.
Best filter for smoke? MERV 13 (Optimal). Add an Odour Eliminator for the smell.
Easiest fix? Close the windows, run the furnace fan, and swap your filter every 60–90 days.
Top Takeaways
The live map shows current air quality anywhere in Alberta, updated hourly. It’s the fastest way to answer “Is the air bad out today?”
Alberta’s air is reported on Canada’s official AQHI scale (1–10+) through a network of local airsheds, while most global apps show a U.S.-style AQI (0–500). On both, a higher number means to take more care.
Most elevated readings come from wildfire smoke between May and September, or from winter temperature inversions on cold, still days.
On poor-air days: close the windows, run your HVAC fan, and rely on a higher-rated filter.
A MERV 13 (Optimal) filter captures the fine smoke particles standard filters miss, and an Odour Eliminator helps with the smell.
Free shipping to Canada, 600+ sizes, and Subscribe & Save make it easy to stay ahead of smoke season.
How to Read the Map: AQI Numbers Explained
Most maps report air quality as a single number, and it climbs as pollution does. The higher it goes, the more sense it makes to ease up on time outdoors, especially for kids, older adults, and anyone living with asthma or a heart condition. Here’s what the standard scale means in plain terms.
| AQI | Category | What It Means for You |
|---|---|---|
| 0–50 | Good | Air is clean. A great day to open the windows. |
| 51–100 | Moderate | Generally fine. Unusually sensitive people may notice mild effects. |
| 101–150 | Unhealthy for Sensitive Groups | Sensitive groups should take it a little easier outdoors. |
| 151–200 | Unhealthy | Everyone may feel some effect, so limit long stretches of exertion outside. |
| 201–300 | Very Unhealthy | Reduce outdoor activity and keep the windows closed. |
| 301+ | Hazardous | Stay indoors where you can and lean on good filtration. |
AQI vs. AQHI: What Alberta Actually Uses
Most people don’t realise Canada has its own scale. American apps show the AQI you may recognise, but Alberta’s air is reported on something else. It’s called the Air Quality Health Index (AQHI), it runs from 1 to 10+, and it’s built around health risk rather than the concentration of a single pollutant.
What’s distinctive about Alberta is who measures it. A network of local airsheds, including the Calgary Region Airshed Zone, the Alberta Capital Airshed around Edmonton, and Fort Air Partnership in the industrial heartland, feeds real-time data into the provincial AQHI map. Both scales move the same way: a higher number means take a little more care. They’re just calculated differently, so our map tells you which one you’re looking at and saves you the guesswork.
| Measure | AQI (U.S. Style) | AQHI (Alberta / Canada) |
|---|---|---|
| Scale | 0–500 | 1–10+ (Low, Moderate, High, Very High Risk) |
| Based On | The single worst pollutant | Combined health risk from PM2.5, ozone, and NO₂ |
| Reported By | IQAir, aqicn, and many global apps | Alberta’s airsheds and Environment and Climate Change Canada |
| Alberta Extra | — | AQHI+ PM2.5 layer used during wildfire smoke events |
Is the Air Quality Bad in Alberta Today?
It depends on where you live and the time of year. Alberta covers a lot of ground, and conditions change by region, by season, and even by the hour. The fastest answer is the map above. Find your city, read the number. Anything in the Good or Low-risk range means the air is clean and you can carry on as usual. When readings climb into the Unhealthy or High-risk range, the cause is almost always wildfire smoke between May and September, or a winter temperature inversion that traps pollution close to the ground on cold, still days. If your area is running high, keep the windows shut and let a good filter quietly do its job.
What’s Affecting Alberta’s Air Right Now
A handful of factors drive most of the day-to-day changes you’ll see on the map:
Wildfire smoke. Alberta’s wildfire activity typically peaks in May and runs through September. Smoke can lift fine-particle levels fast, often hundreds of kilometres from the fire itself. Northern communities near Fort McMurray tend to be hit hardest and for the most days.
Fine particulate matter (PM2.5). These tiny particles are what most indices watch most closely, because they travel deep into the lungs. In Alberta, they spike with both summer wildfire smoke and winter smog.
Winter temperature inversions. On cold, still days, a layer of warm air can settle over Alberta’s valleys and cities and trap pollutants near the ground through the long heating season. It’s a genuinely local cause that pages written for warmer provinces tend to miss.
Ground-level ozone and smog. On hot, sunny, stagnant summer afternoons, ozone can build up, mostly across the south of the province.
Following a specific smoke event? Our live wildfire and smoke map for Canada shows where the fires and smoke are right now.
Air Quality by Region and Major City
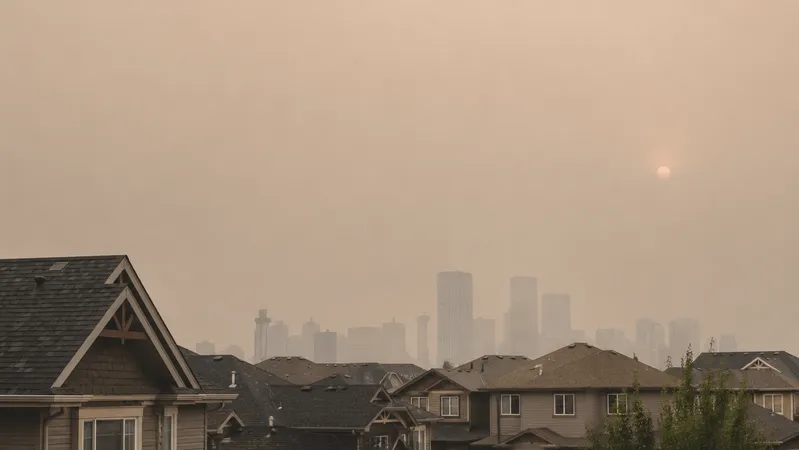
Northern Alberta and southern Alberta can have completely different air on the same day. Fort McMurray may sit under heavy smoke while Lethbridge stays clear, and a winter inversion can settle over Calgary or Edmonton while the foothills breathe easy. Zoom into your region on the map, or check your local centre.
Major cities: Calgary · Edmonton · Red Deer · Lethbridge · Fort McMurray · Medicine Hat · Grande Prairie.
Local monitoring: Each region is watched by its own airshed, which is why Alberta’s AQHI map is unusually detailed. When you want the official local reading, the airsheds and Environment and Climate Change Canada are the sources to trust.
How to Protect Your Indoor Air on Poor-Air Days
When the map turns orange or red, the job is simple. Keep the outdoor air out, and clean the air you already have inside. Here’s how.
Close the windows and doors when smoke or smog is in the area.
Run your furnace or HVAC fan so air keeps cycling through your filter, even if you don’t need the heat.
Fit a higher-rated filter. A MERV 13 (Optimal) filter captures the fine smoke particles and allergens that standard filters let slip through.
Change it more often during smoke season, because a clogged filter can’t do its job.
For smoke and the smell it leaves behind, our Odour Eliminator carbon-infused filters help clear the haze-day odour that settles into a closed-up home. And because every Filterbuy order ships free to Canada with no minimum, keeping a spare on hand before smoke season is easy.
We’ve spent more than a decade around furnace filters, and every Alberta summer runs the same way. The day a smoke advisory hits the north, our orders from that region jump. People feel the air change before they ever look at a number. What we tell our own neighbours is simple. You can’t control the wildfire smoke outside, but you can control what your furnace pulls through. On a hazy day, a clean MERV 13 does more for a closed-up home than almost anything else, and most people are running a filter that’s a step or two too low. So check the map, then check the date on your filter. Those two habits, together, are what keep the air inside clean.
— Indoor Air Quality Specialists, Filterbuy
7 Trusted Resources to Check Alberta’s Air and Breathe a Little Easier
Here’s the honest truth: we make air filters, not monitoring stations. So when it comes to the live numbers and the science behind them, we’d rather point you to the people who do that for a living. Think of this as the list we’d hand a neighbour over the back fence — the seven places we check ourselves, in the order the questions usually come up: what’s the air doing in my community, why is it like this, and what can I do about it?
1. See Your Community’s Exact Reading, Updated Every Hour
This is Alberta’s own AQHI map, and it’s the one we’d check first. Find your community, from Calgary to Fort McMurray to a smaller town that doesn’t always make the forecast, and you’ll see the current reading, refreshed hourly. During smoke season, it folds in extra sensors so more places get covered.
Source: airquality.alberta.ca
2. Plan Tomorrow, Not Just Right Now
Environment and Climate Change Canada shows today’s numbers alongside the forecast for tonight and tomorrow, city by city. It’s the one to check when you’re wondering whether tomorrow’s hockey practice or morning walk is a good idea.
Source: weather.gc.ca
3. Understand Why the Air Turned Hazy
From May through September, wildfire smoke is usually why Alberta’s numbers climb. This page explains, calmly and without scare tactics, how the province keeps an eye on it, including an hourly smoke layer, and links you straight to any current advisories.
Source: alberta.ca/wildfire-smoke-information
4. Know What to Do When the Number Climbs
A reading only helps if you know what to do with it. Alberta Health Services offers clear, friendly guidance on who should take extra care and when to ease up on outdoor plans — especially worth a read if someone at home lives with asthma or a heart condition.
Source: albertahealthservices.ca/news/air.aspx
5. Finally, Make Sense of the Numbers
Not sure what separates the AQI from Canada’s AQHI? No worries. This is a plain-language explainer of what the numbers mean and how the two scales line up — a good place to start if they’ve ever left you guessing.
Source: en.wikipedia.org/wiki/Air_quality_index
6. Compare Alberta’s Air with Anywhere Else
IQAir maps Alberta in real time using the global AQI scale you’ll spot in most apps. Handy as a quick second opinion next to the official AQHI, or if you’re simply curious how your home compares with the rest of the world.
Source: iqair.com/ca/canada/alberta
7. Zoom Right Down to the Nearest Monitor
When you’d rather see the station closest to you than a community average, this real-time map lays out Alberta monitor by monitor. It’s the most detailed of the independent views, and a nice companion to the official reading.
Source: aqicn.org/map/alberta
3 Numbers That Put Alberta’s Air in Perspective
A little context helps. These three figures, each from a source we’ve checked ourselves, explain why glancing at the map has become a normal part of the Alberta summer, and why the filter in your furnace matters more than it used to.
2023 was Alberta’s worst wildfire year on record. Wildfires burned about 2.2 million hectares, roughly 63% more than the previous record set in 1981, and far more than any other year in the past century. That same season, smoke lingered over some northern Alberta stations for more than 100 days of the year. It’s the reason smoke-affected air days have become so much more common across the province.
The highest peak PM2.5 in Alberta this century came from Fort McMurray. During the 2016 Horse River wildfire, monitors in the city recorded a peak one-hour PM2.5 reading above 5,000 µg/m³ — the highest the province has seen between 2000 and 2024, and a stark reminder of how fast smoke can change the air.
Alberta logged 1,066 PM2.5 exceedances in 2024. That’s how many times locations across the province exceeded the 24-hour air-quality objective for fine particulate matter, driven mainly by wildfire smoke and winter smog. Clean indoor air is worth the small effort on those days.
Final Thoughts: Clean Air Is a Habit, Not a Headline
Here’s our honest take. Coverage of air quality tends to swing between two extremes. One week, it’s a five-alarm emergency. The next, it’s ignored until the sky turns orange. Neither helps much. The truth sits somewhere calmer. Most days, in most of Alberta, the air is fine, and on the handful of days it isn’t, a few simple habits make a genuine difference.
Checking an air quality map shouldn’t make anyone anxious. It should do the opposite. It should leave you informed and a little more in control, the same way a weather forecast does. You can’t change what’s happening outside, but the air inside your own home is entirely yours to manage. In our experience, the people who breathe easiest aren’t the ones who worry most. They’re the ones who quietly keep a decent filter in the furnace and swap it on schedule. That’s the whole secret.
Your Next Steps for Cleaner Indoor Air
Bookmark this page and check the map whenever the sky looks hazy or a smoke advisory is in the news.
Learn which scale your region reports. AQHI shows on official Alberta forecasts; AQI shows on most global apps, so the numbers make sense at a glance.
Check the date on your current furnace filter. If it’s been more than 60–90 days, it’s due.
Match the filter to your needs: Superior (MERV 11) for everyday allergens, Optimal (MERV 13) for wildfire smoke and fine particles, or Odour Eliminator for smoke and cooking smells.
Set up Subscribe & Save so a fresh filter arrives on schedule. Edit, skip, or cancel anytime.
Frequently Asked Questions
Breathe Easier, Whatever the Map Says
Clean air shouldn’t depend on the weather. Whatever today’s reading says, the right filter keeps your home’s air fresh through smoke season, allergy season, and the long Alberta winter when the windows stay shut. With over 600 sizes, including the hard-to-find ones, plus free shipping to Canada and Subscribe & Save so you never run out, it’s easy to set and forget. We’ve earned over 85,000 five-star reviews from customers across North America, and we’d rather earn your trust than push you into the wrong product.