
Whitby Real-Time AQI Tracker
What's Actually In Whitby Air Today?
What High AQI Means for Your Lungs in Whitby
How to Read AQI
The Air Quality Index (AQI) measures how polluted the air is and how it may affect your health.
0–50 (Good): Air quality is satisfactory.
51–100 (Moderate): Acceptable, but some pollutants may pose minor concerns.
101–150 (Unhealthy for Sensitive Groups)
151–200 (Unhealthy)
201–300 (Very Unhealthy)
301+ (Hazardous)
Moderate
Still okay for most, but if you have asthma or allergies, take it easy and avoid long outdoor workouts.
Shop MERV 11 filters→What's the Right Filter for Your AQI Level?




Check Today's Live Real Time Air Quality Index AQI Map in Whitby, ON Now
TL;DR
Whitby's live air quality is reported on the Air Quality Health Index (AQHI), the federal and provincial scale that runs from 1 to 10+. Use the map above for the current number. Whitby has no monitoring station of its own, though, so the reading published under its name is measured in north Oshawa, several kilometres away and noticeably higher up. The section below explains what that station can and cannot see.
Key Takeaways
The AQHI is Canada's official air quality scale. It runs from 1 to 10+, not the 0 to 500 range used by the American AQI that many weather apps display.
Whitby is not home to any of the 38 ambient air monitoring stations the Ontario Ministry of the Environment, Conservation and Parks operates province-wide.
The station supplying Whitby's AQHI sits at 161 metres above sea level on Britannia Avenue West in north Oshawa, on land that was once E.P. Taylor's Windfields Farm.
Ontario calculates the AQHI from three pollutants: ground-level ozone, fine particulate matter (PM2.5) and nitrogen dioxide.
Environment and Climate Change Canada notes that real-time AQHI data has not undergone detailed quality control, so treat the live number as a strong indication rather than a verified measurement.
How To Read Whitby's Air Quality Reading Right Now
Ontario reports Whitby's air quality on the Air Quality Health Index, a 1 to 10+ scale published hourly by Environment and Climate Change Canada with the Ontario Ministry of the Environment, Conservation and Parks. Lower numbers mean lower health risk. The scale has four bands, each with separate guidance for the general population and for people at higher risk.
The AQHI is a health risk scale, not a pollution concentration. A reading of 4 means the combined short-term health risk from ozone, PM2.5 and nitrogen dioxide was modelled at that level for that hour. Read the forecast maximums alongside the current observation, because a low reading at breakfast does not rule out a higher one later.
Where Whitby's Air Quality Reading Is Actually Measured
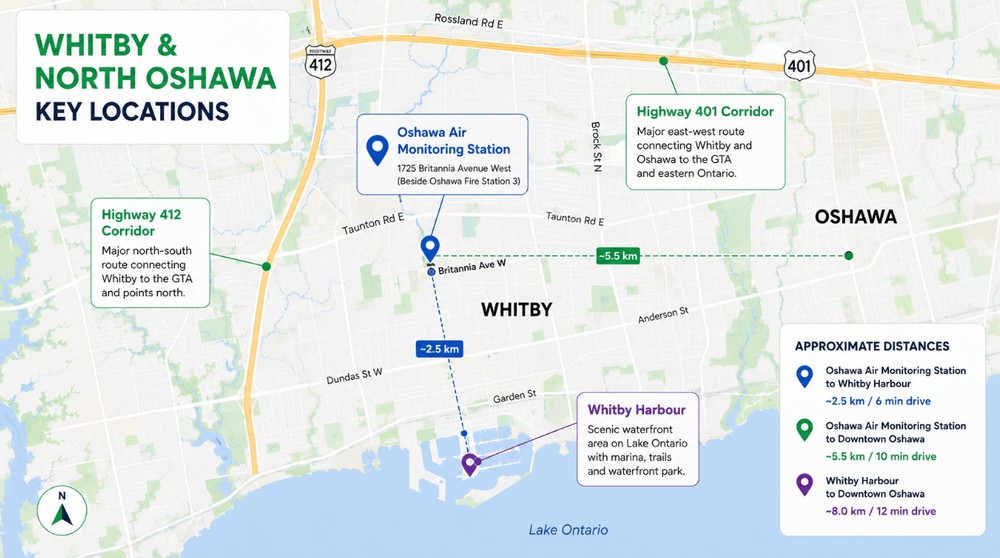
Whitby has no air quality monitor inside its borders. The AQHI published for Whitby is measured at the Oshawa station, site 45027, on Britannia Avenue West at the former E.P. Taylor Stables. We took the coordinates the province publishes for that station and measured the distances ourselves: roughly 8.5 km northeast of downtown Whitby, about 10.5 km north of Whitby Harbour, and roughly 9 km north of the Highway 401 corridor.
That address is worth picturing. The land at Britannia Avenue West is the former Windfields Farm, the thoroughbred operation E.P. Taylor bought from Colonel R.S. McLaughlin in 1950 and the birthplace of Northern Dancer. Ontario Tech University now holds much of it. The monitor is classified as urban, yet it stands on open former farmland at the northern edge of the built-up area.
I have written this page for a lot of Canadian cities, and Whitby is the first where I could not find the monitor. I went looking expecting to name a street in Whitby. Instead I found a former thoroughbred farm in north Oshawa, uphill and well back from the lake. That distance between where the number is measured and where people actually live is the story of this page.
— Michelle Wan, Brand Manager and Air Quality Writer, Filterbuy Canada
Three things follow from where that station sits.
1. The Elevation Gap
The Oshawa monitor sits at 161 metres above sea level, about 70 metres higher than Whitby's town elevation of roughly 91 metres. On calm nights, cool air pools in low-lying ground near the lake while higher ground clears, so a lakeside street and a monitor 70 metres uphill can be breathing measurably different air.
2. The Distance From Whitby's Traffic Corridors
Highway 401 runs east to west through the middle of Whitby, and Highway 412 runs north to south with its entire 8.9 km length inside Whitby's borders. The 412 opened in June 2016, was tolled from February 2017, and became toll-free on 5 April 2022, a change Whitby Town Council pursued specifically to pull traffic off local roads. Traffic patterns inside Whitby shifted materially that year, and no monitor was there to record what it did to local air pollution.
3. One Monitor, Eight Municipalities
Durham Region's roughly 697,000 residents across eight municipalities share that one station. Oshawa's annual air quality report to council, INFO-26-13, states it is the only such station in the region.
The ministry itself cautions that its stations represent general population exposure and do not necessarily reflect air quality where local or industrial sources dominate.
It has not always been there. Before 2005 the station sat at Ritson Road Public School in central Oshawa, so the long-run record for this area comes from two locations.
Whitby is not entirely unmeasured. The Gerdau steel mill runs its own ambient monitoring network on the Whitby lakeshore, but it tracks total suspended particulate and metals, reports separately, and does not feed the AQHI.
The Oshawa reading is not wrong. Durham Region shares one regional air mass, and Whitby, Oshawa, Ajax and Pickering usually report within a point or two of each other. It is a regional signal rather than a street-level one.
The AQHI And The AQI Are Two Different Scales
Whitby residents often see two different air quality numbers on the same day, and both can be correct. Canada uses the AQHI, a health risk index from 1 to 10+ built on ozone, PM2.5 and nitrogen dioxide. The American AQI runs 0 to 500, covers a wider pollutant set and uses different breakpoints, and many weather apps default to it even in Canadian cities. The two do not convert into one another.
What Moves Whitby's Air Through The Year
Whitby sits on the north shore of Lake Ontario at the eastern edge of the Greater Toronto Area, so it shares the seasonal drivers behind air quality across Ontario, and it is that annual rhythm Filterbuy Canada builds its Canadian filter guidance around.
Two patterns matter most. Summer ozone across the Golden Horseshoe is shaped by lake breeze circulation, which carries pollutants inland on hot, sunny stretches. Wildfire smoke, arriving from fires hundreds of kilometres away, can move readings from low risk to high risk within hours, regardless of anything happening locally.
Supporting Statistics
Three findings from United States agencies, and what each means here.
1. Roughly 90 per cent of the day happens indoors
People spend about 90 per cent of their time indoors.
Some pollutants run 2 to 5 times higher indoors than outdoors.
The map reading is air you pass through, not air you live in.
Source: US EPA, Indoor Air Quality
2. Closed windows halve smoke. A filter halves it again
Windows shut, no air cleaner: indoor PM2.5 runs about 55 to 60 per cent of outdoor, ranging 30 to 100 per cent across homes.
High-efficiency filter plus continuous fan: about 50 per cent lower.
Low-efficiency filter plus continuous fan: about 24 per cent lower.
Source: US EPA, Strategies to Reduce Exposure Indoors
3. Unmonitored communities are a documented gap
152.3 million people, 44 per cent of Americans, live in counties failing on ozone or particle pollution.
Many counties are not monitored at all.
Whitby's missing station fits a documented pattern rather than a local quirk.
Source: American Lung Association, State of the Air 2026
Filtering The Air You Can Actually Control
You cannot change what the Oshawa monitor reads, but you can change what circulates through your home in the meantime, and that is where Filterbuy Canada comes in. Whitby homes run their furnaces through a long heating season, so household air passes through a single filter thousands of times between changes.
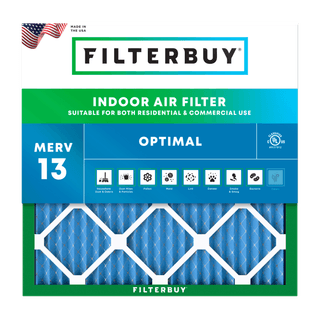
Health Canada recommends filters rated MERV 13 or higher for the fine particulate in wildfire smoke, and advises using the highest rating a system can safely handle. Our guide to choosing a MERV rating covers that trade-off. Confirm your maximum in the equipment manual or with a licensed HVAC technician first, because a filter that is too restrictive can reduce airflow.
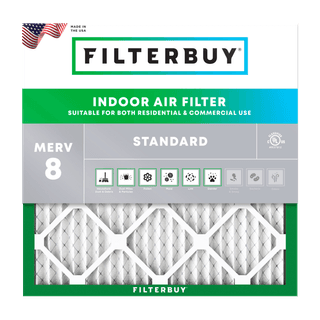
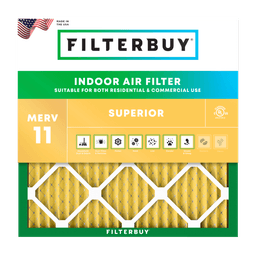
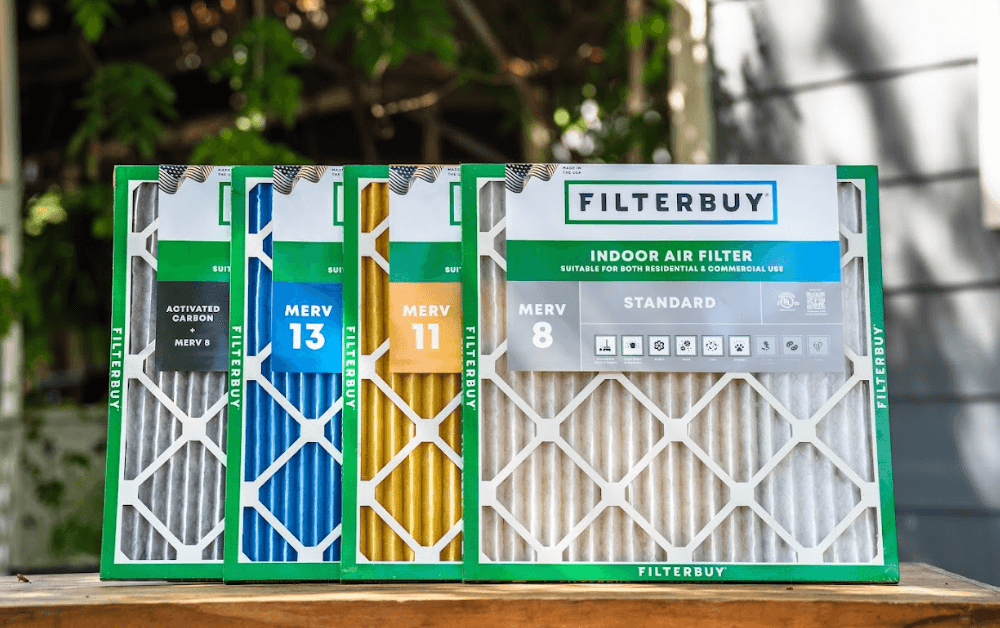
Filterbuy Canada carries all three ratings in over 600 sizes, including the Optimal (MERV 13) tier, with free shipping to Canada and no minimum purchase. The advice we give during a smoke event is to inspect the filter weekly rather than wait out the calendar. A smoke-loaded filter keeps passing air long after it has stopped cleaning much, so airflow at the vents is a poor test. Replace it when the media looks grey or smells of smoke.
Frequently Asked Questions
Glossary
AQHI (Air Quality Health Index): Canada's official air quality scale, running 1 to 10+, calculated from ozone, PM2.5 and nitrogen dioxide and published hourly by Environment and Climate Change Canada.
AQI (Air Quality Index): The United States Environmental Protection Agency's 0 to 500 air quality scale. It is not interchangeable with the AQHI.
PM2.5: Fine particulate matter 2.5 micrometres in diameter or smaller, small enough to reach deep into the lungs. Measured in micrograms per cubic metre.
Ground-level ozone (O3): A gas formed when sunlight reacts with vehicle and industrial emissions. It peaks on hot, sunny afternoons.
Nitrogen dioxide (NO2): A combustion gas, produced mainly by vehicle engines and furnaces.
Station 45027: The Air Quality Ontario identifier for the Oshawa ambient air monitoring station on Britannia Avenue West, the source of Whitby's published AQHI.
MERV (Minimum Efficiency Reporting Value): The ASHRAE standard rating an air filter's particle capture efficiency, 1 to 16 for residential filters. Higher numbers capture smaller particles. Filterbuy Canada labels them Standard, Superior and Optimal.
Essential Resources For Whitby
Air Quality Ontario, Oshawa station page. Hourly ozone, PM2.5 and nitrogen dioxide readings behind Whitby's AQHI, plus station coordinates and elevation.
Environment and Climate Change Canada, Oshawa AQHI. Current observed reading plus forecast maximums for the next 24 hours.
Air Quality Ontario, provincial AQHI map. Every Ontario station on one map, for comparing Durham against Toronto.
Canada.ca, Air Quality Health Index. How the AQHI is calculated and who counts as at higher risk.
Health Canada, Guidance for Cleaner Air Spaces during Wildfire Smoke Events. The federal source behind the MERV 13 guidance above.
Region of Durham, Air Quality. Local notifications and Special Air Quality Statement guidance.
Filterbuy Canada, which MERV rating should I use. What each rating captures in plain language, and how to match one to your system.
Written by Michelle Wan, Brand Manager and Air Quality Writer, Filterbuy Canada.
Technically reviewed by David Clark, Licensed HVAC Technician.
Published: 25 August 2026.