Shop by
The Air Quality Index (AQI) measures how polluted the air is and how it may affect your health.
0–50 (Good): Air quality is satisfactory.
51–100 (Moderate): Acceptable, but some pollutants may pose minor concerns.
101–150 (Unhealthy for Sensitive Groups)
151–200 (Unhealthy)
201–300 (Very Unhealthy)
301+ (Hazardous)
Still okay for most, but if you have asthma or allergies, take it easy and avoid long outdoor workouts.
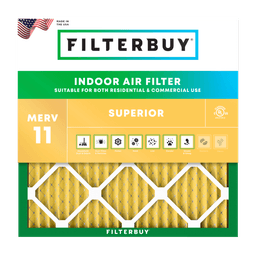
Shop MERV 11 filters→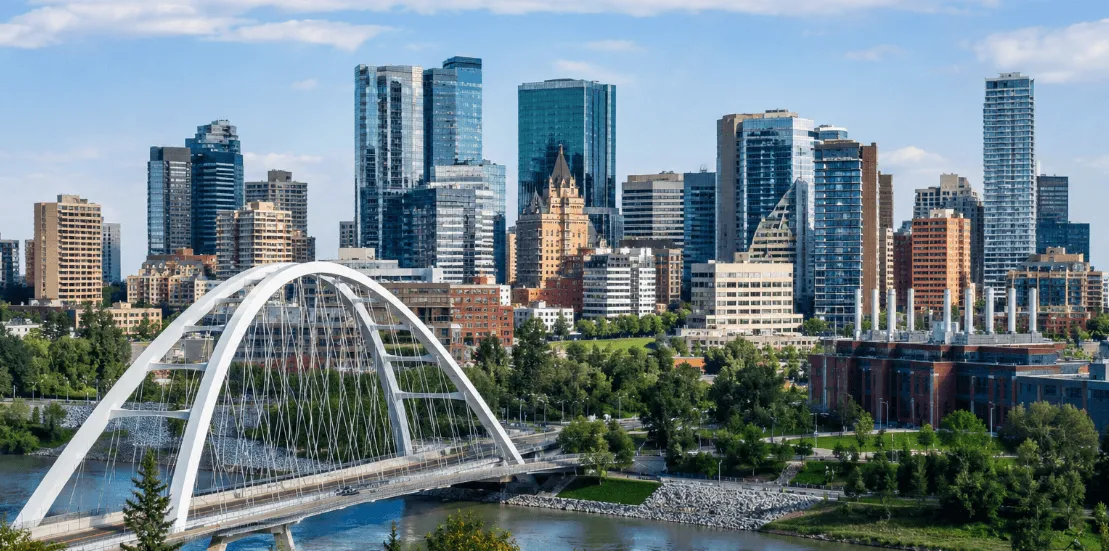
Step outside in Edmonton on a July afternoon, and the air can tell two different stories by suppertime. The map at the top of this page shows which one you’re getting right now: your neighbourhood’s air quality, refreshed every hour. Find your part of the city, and you’ll know in a few seconds whether to throw the windows open or keep them shut.
Conditions here move quickly. A clear morning over the river valley can turn hazy by mid-afternoon when wildfire smoke drifts down from northern Alberta, B.C., or Saskatchewan. Most days, mind you, the air is perfectly fine. This page is here to help you read today’s number, see what sits behind it, and sort out the few simple things that keep the air inside your home clean. Want the wider view? You can also see air quality across Alberta.
Want today’s air? Open the live map up top, find Edmonton or your neighbourhood, and read the number. It updates every hour.
Is it bad? “Good” or “Low Risk” means clean air. “Unhealthy” or “High Risk” usually means wildfire smoke, a winter inversion, or a local industrial or traffic flare-up, so it’s a good time to stay in and filter the air.
AQI or AQHI? Edmonton reports officially on the AQHI (1 to 10+) through the Alberta Capital Airshed. Most global apps show the AQI (0 to 500). Either way, a higher number means to take more care.
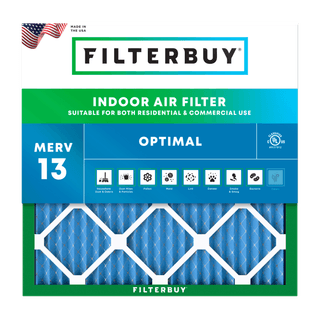
Best filter for smoke? A MERV 13 (Optimal), with an Odour Eliminator for the smell.
Easiest fix? Close the windows, run your furnace fan, and swap your filter every 60 to 90 days.
The live map answers “Is it bad out?” in seconds. No app, no sign-up.
Edmonton reports air quality on the AQHI, a 1-to-10+ health-risk scale managed through the Alberta Capital Airshed.
Most poor-air days here trace back to wildfire smoke (roughly May through September) or a winter inversion that settles into the North Saskatchewan River valley. Local industry and traffic do the everyday work.
When the air turns, the basics carry you: close the windows, keep the HVAC fan running, fit a higher-rated filter.
MERV 13 catches the fine smoke particles standard filters miss. An Odour Eliminator clears the smell that hangs around a closed-up home.
Filterbuy ships free to Canada, carries over 600 sizes, and offers Subscribe & Save, so a fresh filter turns up on schedule.
The colours on the map follow the Air Quality Index (AQI). The lower the number, the cleaner the air. Here's what each band means when you're reading the Edmonton AQI map.
| AQI | Category | What It Means |
|---|---|---|
| 0–50 | Good | Air is clean. A great day to open the windows. |
| 51–100 | Moderate | Generally fine. Unusually sensitive people may notice mild effects. |
| 101–150 | Unhealthy for Sensitive Groups | Sensitive groups should take it a little easier outdoors. |
| 151–200 | Unhealthy | Everyone may feel some effect. Limit long stretches of exertion outside. |
| 201–300 | Very Unhealthy | Reduce outdoor activity and keep the windows closed. |
| 301+ | Hazardous | Stay indoors where you can and lean on good filtration. |
Curious how the index gets built? There’s a plain-language overview of the air quality index worth a read.
Checked a couple of apps and saw two different numbers? That’s the two scales at work.
Edmonton’s official measure is the Air Quality Health Index, or AQHI, a scale from 1 to 10+ that blends the health risk from several pollutants at once: fine particulate matter (PM2.5), ozone, and nitrogen dioxide. The Alberta Capital Airshed reports it, running the continuous monitoring stations in and around the city with Alberta Environment and Protected Areas. Two neighbouring groups fill in the rest of the regional picture: the West Central Airshed Society to the west, and the Fort Air Partnership (now the Heartland Air Monitoring Partnership), which watches the Industrial Heartland north-east of the city. When wildfire smoke rolls in, you’ll often see an AQHI+ reading that zeroes in on PM2.5.
Most global apps show the AQI instead, a 0-to-500 scale based on whichever single pollutant is worst at the moment. Neither one is right nor wrong. They’re just built differently, and the table below lines them up.
| Measure | AQI (Global Apps) | AQHI (Edmonton / Canada) |
|---|---|---|
| Scale | 0 to 500 | 1 to 10+ (Low, Moderate, High, Very High Risk) |
| Based On | The single worst pollutant | Combined health risk from PM2.5, ozone and NO₂ |
| Reported By | IQAir, aqicn, global apps | Alberta Capital Airshed & Environment and Climate Change Canada |
| Edmonton Extra | — | AQHI+ PM2.5 reading during wildfire smoke events |
Depends on the day and the season, and the quickest way to find out is the live map up top. Find Edmonton, read the number, done. A “Good” or “Low Risk” reading means the air is clean. A higher one usually means something specific is going on.
When the number climbs in Edmonton, wildfire smoke is the usual culprit (roughly May through September), or a winter inversion: those cold, still days when a lid of warm air traps pollution down in the river valley. If the map is showing an unhealthy or high-risk range, keep the windows closed and let a good filter do the work.
A few things tend to push the number up here:
Fine particulate matter (PM2.5). These particles are small enough to reach deep into the lungs, which is why most indices watch them so closely. In Edmonton, PM2.5 climbs with summer wildfire smoke and winter smog.
Wildfire smoke (May to September). Fine smoke can travel hundreds of kilometres from fires in northern Alberta, B.C., or Saskatchewan. In 2023, it settled over the North Saskatchewan River valley for days at a stretch.
Winter temperature inversions. Through Edmonton’s long heating season, cold, still days can pin pollutants close to the ground. That’s a local cause most pages written for warmer cities skip right over.
Local industry and traffic. Refining and combustion around the region, the Industrial Heartland north-east of the city included, plus everyday road traffic, make up Edmonton’s steady background sources.
Tracking a specific smoke event? You can also check the live wildfire and smoke map for Canada.
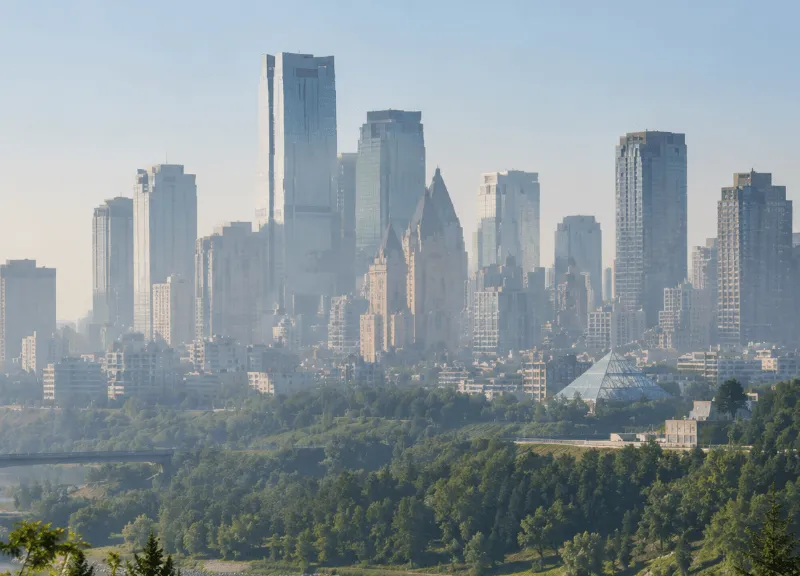
Edmonton’s reading isn’t one guess for the whole city. It’s pieced together from continuous monitoring stations across town, run jointly by Alberta Environment and Protected Areas and the Alberta Capital Airshed, with community sensors adding finer neighbourhood detail during smoke season.
That matters because the air can read differently from one part of town to the next. Central Edmonton, the river valley, and the industrial north-east don’t always match. Zoom into your own corner of the map for the closest picture, and for the official local number, lean on the Alberta Capital Airshed and Environment and Climate Change Canada.
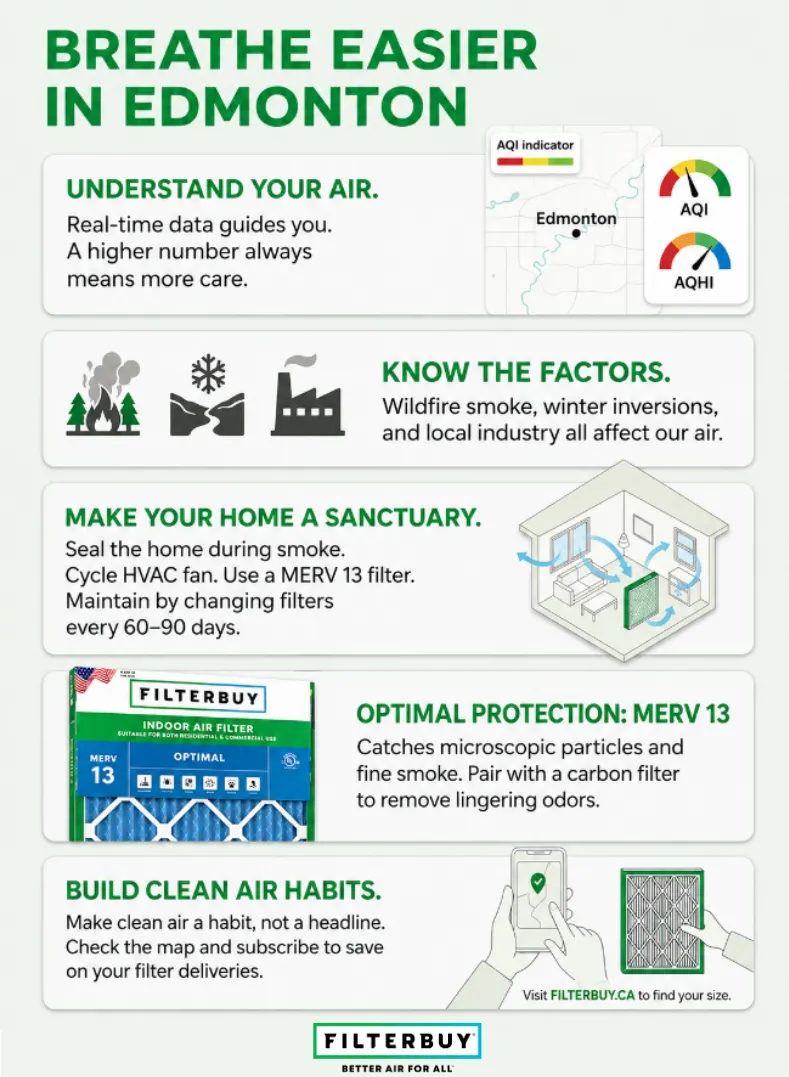
The smoke outside isn’t yours to fix. The air inside your home is. On a poor-air day, a few simple moves make a real difference:
Close the windows and doors when smoke or smog is around.
Run your furnace or HVAC fan so air keeps cycling through the filter, even when you don’t need the heat.
Fit a higher-rated filter. A MERV 13 (Optimal) catches the fine smoke particles that standard filters let through.
Change it more often throughout the smoke season. A clogged filter can’t do its job, however good it is.
For the smell of smoke left in a shut-up house, our Odour Eliminator carbon filters help clear it. And every order ships free to Canada, with no minimum.
You can almost set your watch by it. The morning a smoke advisory hits the Edmonton area, the orders start coming in. People feel the air change before they ever check a number. We tell folks the same thing every time: you can’t control the smoke outside, but you can control what your furnace pulls through. On a hazy day, a clean MERV 13 does more for a shut-up home than just about anything else.
— Indoor Air Quality Specialists, Filterbuy
Had a look at the map? Here’s where we’d point a neighbour who wanted to dig a little deeper. We build the filters, not the monitoring stations, so for the official numbers and the local guidance worth trusting, these are the sources we check ourselves. No sign-ups, no fuss.
The official word on Edmonton’s air, reported by the community and refreshed every hour. When you want to double-check the number for your own part of town, start here.
Source: https://airquality.alberta.ca/map/
Along with the current reading, you get a forecast and a next-24-hours outlook. Handy for planning the weekend, a run, or whether to leave the windows open overnight.
Source: https://weather.gc.ca/airquality/pages/abaq-001_e.html
Your local airshed watches the air across Metro Edmonton and adds finer, neighbourhood-level detail. Worth a look on smoky days, when central Edmonton and the river valley don’t read the same.
Source: https://capitalairshed.ca/live-air-data-map/
When the sky goes orange, this explains what’s behind it. The thing to watch in wildfire smoke is fine particulate matter (PM2.5), tiny particles 2.5 micrometres or smaller, and the page walks you through it plainly.
Source: https://www.alberta.ca/wildfire-smoke-information
Practical, friendly guidance for poor-air days: keep the windows and fresh-air intakes closed, run a HEPA cleaner if you’ve got one, and check your furnace filter more often than usual. It’s doing extra work when there’s smoke about.
Source: https://www.albertahealthservices.ca/news/air.aspx
Not sure what a “7” means for your day? This breaks the 1-to-10+ scale down in plain language, with sensible advice for everyone and a little extra for those who feel the air more keenly.
Source: https://www.alberta.ca/about-the-air-quality-health-index
A handy second opinion. It splits the reading into PM2.5, ozone, and the rest, and lets you compare Edmonton with anywhere else. Useful if you’re travelling or just curious about the bigger picture.
Source: https://aqicn.org/city/edmonton/
4 monitoring stations. Edmonton’s official AQHI is built from four continuous monitoring stations inside the city, with more across the capital region through the Alberta Capital Airshed, and it refreshes every hour. Your reading stays local and current.
2.2 million hectares. Alberta’s 2023 wildfire season burned a record 2.2 million hectares, about ten times the five-year average, and the smoke sat over Edmonton’s river valley for days. That’s a big part of why smoke days have become a normal fixture on the calendar.
5 µg/m³. That’s the World Health Organization’s annual guideline for fine particles (PM2.5). During wildfire smoke, Edmonton’s PM2.5 can run several times that level, which is exactly what a higher-rated filter is built to catch.
Most days in Edmonton, the air is just fine. On the few days it isn’t, a couple of small habits carry you through. A map like this one should leave you feeling clued-in and a bit more in control, the way a weather forecast does, not on edge.
From what we’ve seen, the people who breathe easiest aren’t the ones doing the most worrying. They’re the ones who keep a decent filter in the furnace and swap it on schedule. That’s most of the job, sorted.
Bookmark this page and check the map whenever the sky looks hazy or a smoke advisory is in the news.
Know which scale your region uses: AQHI on the official Alberta forecasts, AQI on most global apps.
Check the date on your furnace filter. If it’s been past 60 to 90 days, it’s due.
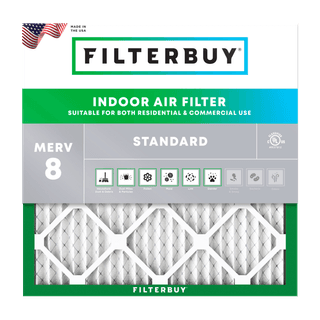
Match the filter to the job: Superior (MERV 11) for everyday allergens, Optimal (MERV 13) for wildfire smoke, or Odour Eliminator for smoke and cooking smells.
Set up Subscribe & Save so a fresh filter arrives on schedule. Edit, skip, or cancel whenever you like.
Check the live map at the top of this page. Find Edmonton or your neighbourhood and read the current number, updated hourly. A “Good” or “Low Risk” reading means clean air. A higher one usually points to wildfire smoke, a winter inversion, or a local source. For the official figure, trust the Alberta Capital Airshed and Environment and Climate Change Canada.
It varies by the day and the season, so check the live map above for your area. “Good” or “Low Risk” means clean. Higher readings in Edmonton usually mean wildfire smoke (roughly May to September) or a winter temperature inversion. On those days, keep the windows shut and run a good filter.
AQI is a 0-to-500 scale that many global apps use, based on the single worst pollutant. AQHI is Edmonton’s official 1-to-10+ scale, reported through the Alberta Capital Airshed and Environment and Climate Change Canada, and it reflects the combined health risk from several pollutants. Both climb as air quality worsens.
The usual causes are wildfire smoke (about May through September), winter temperature inversions on cold, still days, and local industrial and traffic emissions. Environment and Climate Change Canada’s Edmonton forecast usually notes the day’s specific driver.
PM2.5 means fine particles smaller than 2.5 microns, small enough to reach deep into the lungs. In Edmonton, it’s the main driver of poor readings during wildfire smoke and winter smog, and it’s exactly what higher-rated filters are built to catch.
A MERV 13 (Optimal) filter catches the fine smoke particles that standard filters miss, and an Odour Eliminator filter helps with the smell. Change filters more often during the smoke season so they keep working well.
The live map refreshes every hour using data from the provider, and the “Last updated” time sits right beneath it.
With over 600 filter sizes, including the hard-to-find ones, free shipping right across Canada, and more than 85,000 five-star reviews, keeping your home’s air clean is about as easy as it gets. Find your size, set your schedule, and we’ll handle the rest.