Shop by
The Air Quality Index (AQI) measures how polluted the air is and how it may affect your health.
0–50 (Good): Air quality is satisfactory.
51–100 (Moderate): Acceptable, but some pollutants may pose minor concerns.
101–150 (Unhealthy for Sensitive Groups)
151–200 (Unhealthy)
201–300 (Very Unhealthy)
301+ (Hazardous)
Still okay for most, but if you have asthma or allergies, take it easy and avoid long outdoor workouts.
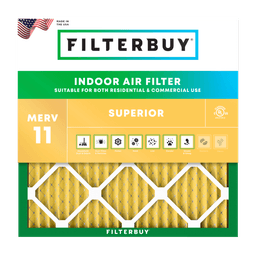
Shop MERV 11 filters→
St. Catharines air quality is measured hourly at a single provincial monitoring station and published as an Air Quality Health Index (AQHI) value from 1 to 10+, shown on the live map above. Readings of 1 to 3 are low risk, 4 to 6 moderate, and 7 to 10 high. Check the map before you make outdoor plans, then decide what to do indoors.
St. Catharines reports air quality through Canada's Air Quality Health Index, a 1 to 10+ scale published hourly by Environment and Climate Change Canada and Ontario's environment ministry. Because a single station serves the whole Niagara Region, that number is a regional signal rather than a street-level measurement. Most elevated readings here come from summer ozone or drifting wildfire smoke, and indoors the two levers you actually control are a closed window and a well-matched furnace filter.
St. Catharines hosts the only AQHI monitoring station in the Niagara Region. Ontario operates 38 province-wide, and exactly one sits on the Niagara Peninsula.
The AQHI runs from 1 to 10+, not 0 to 500. The 0 to 500 scale on most global apps is American; Canada's official reading is the AQHI.
Ontario's ground-level ozone is overwhelmingly imported. On high-ozone days the province attributes roughly 87 to 99 per cent of it to sources outside Ontario.
Wildfire smoke and hot summer afternoons are the conditions most likely to push a reading into the moderate or high band.
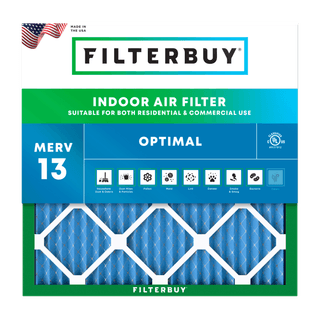
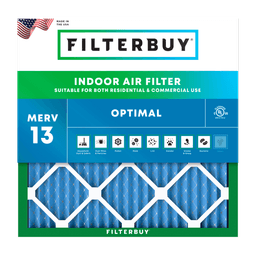
MERV 13, sold as Optimal in the Filterbuy Canada range, is the filter rating the US EPA points to during smoky periods.
The number on the map above is an Air Quality Health Index value, built from three pollutants: fine particulate matter (PM2.5), ground-level ozone and nitrogen dioxide. It scores health risk rather than measuring pollution concentration. Ontario's environment ministry runs the station that produces it; Environment and Climate Change Canada publishes the reading alongside a short-term forecast.
Two scales circulate in Canada, and they are not interchangeable. The AQHI runs 1 to 10+ and is built around health risk, while the AQI runs 0 to 500 and is the US EPA scale most international maps display. Both describe the same air. This page shows the AQI map because that is what people search for, then points you below to the official Canadian reading and, for the provincial picture, to the Filterbuy Canada air quality map for Ontario.
Readings move quickly here, which is why we treat the forecast maximum as the more useful number: a clear morning over Port Dalhousie can turn hazy by mid-afternoon when smoke aloft mixes down, and the current value will not have warned you.
We worked through Ontario's AQHI station list one entry at a time. There are 38 stations, and exactly one sits on the Niagara Peninsula: St. Catharines. If you live in Niagara Falls, Welland, Grimsby, Thorold, Fort Erie or Port Colborne, your nearest official reading is measured here.
The peninsula's shape makes that matter more here than elsewhere in southern Ontario. Niagara is a narrow land bridge between Lake Ontario and Lake Erie, each with its own lake breeze, and the escarpment runs across the middle of it. One reading stands in for roughly 1,850 square kilometres.
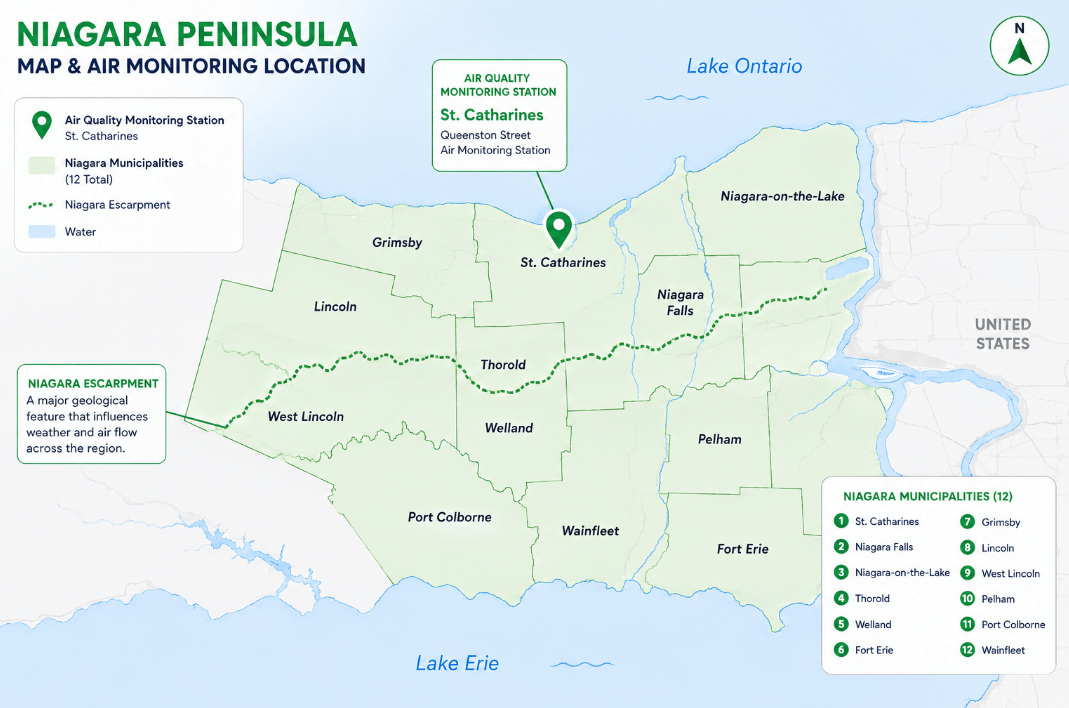
Niagara has roughly 84 per cent of Hamilton's population and one third of its monitoring stations. In practice that makes the St. Catharines value an accurate regional signal and a rough local one, so if you can smell smoke or someone at home is reacting, act on that rather than waiting for the index.
"Checking the number is not the same as knowing what it covers. When I look at a reading for a city like St. Catharines, the first question is where the monitor sits and how much ground it is being asked to speak for. On the Niagara Peninsula, that turned out to be the whole story."
— Michelle Wan, Brand Manager and Air Quality Writer, Filterbuy
Geography compounds the point. Ontario's modelling finds that on elevated-ozone days, transboundary sources account for roughly 87 to 99 per cent of the province's ozone, with US emissions contributing 11 to 38 per cent. St. Catharines sits 19 kilometres from the border, well placed to receive air that was somewhere else that morning.
The AQHI publishes two sets of guidance for every reading: one for people at higher risk, one for everyone else. The at-risk group includes people with heart or lung conditions, seniors, pregnant people, infants and young children, outdoor workers, and anyone exercising hard outside.
Guidance summarized from Environment and Climate Change Canada and the Ontario Ministry of the Environment, Conservation and Parks. If you have a diagnosed heart or lung condition, follow your physician's advice on managing it.
Three limits are worth knowing, all of them stated by the agencies that publish the index.
When wildfire smoke arrives, Environment and Climate Change Canada drops ozone and nitrogen dioxide from the calculation and computes the AQHI hourly from PM2.5 alone. A summer reading during smoke is answering a narrower question than the same number in February.
The AQHI stops at 10+, so past that point the health risk keeps climbing while the number stays put. Treat 10+ as a floor rather than a description, and trust the smoke you can see and smell.
ECCC states plainly that readings vary within a community, and that a community value may differ from individual station readings. Larger cities let you switch to an AQHI by Station view; St. Catharines has one station, so there is nothing to switch between. We went looking for a counter-argument to the point above and found the publisher making it first.
Forecasts are issued at 6:00 am and 5:00 pm local time, so a mid-afternoon check is reading a morning forecast. The WeatherCAN app sends custom air quality notifications if you would rather be told than remember to look.
Canadian furnaces run six to eight months a year, so the filter in a St. Catharines furnace is working from roughly October through April, whatever the outdoor reading says.
Outdoor monitoring stations in the whole US regulatory network. Where no monitor sits, the EPA cannot report air quality for that spot, because it does not interpolate between stations. Official readings are regional signals everywhere, not only in Niagara.
Source: US EPA, AirData Basic Information.
The rise in US asthma emergency department visits above expected levels during 19 days of Canadian wildfire smoke in 2023. New York and New Jersey saw 364 excess visits over 6 to 8 June, from smoke that crossed the border beside St. Catharines.
Source: US CDC, Morbidity and Mortality Weekly Report.
The minimum share of 0.30 to 1.0 micrometre particles a filter must capture to be rated MERV 13 under the ASHRAE test method, alongside 85 per cent at 1.0 to 3.0 and 90 per cent at 3.0 to 10 micrometres. The EPA advises at least MERV 13.
Source: US EPA, What is a MERV rating?
When the reading climbs above 100, the routine is short. Close the windows and doors. If you have an HVAC system, switch the thermostat fan from Auto to On and use an EPA-recommended MERV 13 filter. Run HEPA air purifiers in each room. Avoid activities that add particles indoors, such as burning candles, frying or vacuuming without a sealed vacuum. Check the HVAC filter and replace it if it looks dirty or loaded.
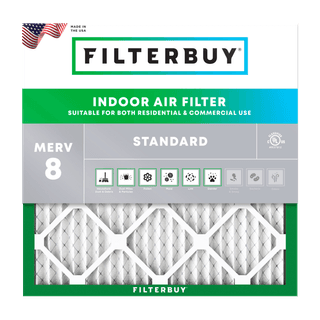
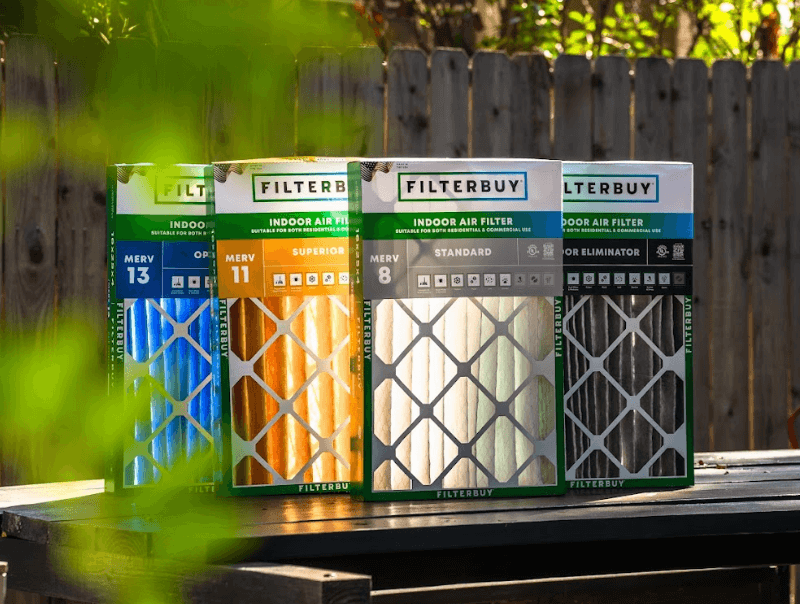
Filter rating is where most of the difference lies. Filterbuy Canada carries pleated filters in three ratings plus a carbon option, all crafted in our own facilities across four US states, so the figures below are our own specifications rather than a reseller's description. The Filterbuy guide to how MERV ratings work explains what each number captures.
A furnace filter is not a respirator and will not make outdoor smoke disappear, but it quietly reduces what circulates through the rooms where you spend the day. Filterbuy Canada ships free to St. Catharines with no minimum order, in over 600 filter sizes including custom , priced in CAD.
Check the live map at the top of this page. Environment and Climate Change Canada publishes the official St. Catharines AQHI hourly, with forecast maximums.
It depends who is asking. An AQHI of 1 to 3 is low risk for everyone. Between 4 and 6, people with heart or lung conditions may want to ease off strenuous activity if symptoms appear. At 7 or above, that widens to children and older adults.
Ontario runs 38 AQHI stations and the Niagara Peninsula has one. Niagara Falls, Welland, Thorold and the rest of the region all take their nearest official reading from St. Catharines.
MERV 13 is the rating the US EPA points to during smoky periods, because it captures fine particulate lower ratings let pass. Check your system is rated for it, and replace it more often while smoke persists.
Every 60 to 90 days suits most homes, which is the schedule Filterbuy Canada builds its auto-delivery around. During an active smoke event, inspect monthly and replace when the filter looks darkened.
AQHI (Air Quality Health Index). Canada's official air quality scale, 1 to 10+, based on the combined health risk of PM2.5, ozone and nitrogen dioxide.
AQI (Air Quality Index). The US EPA scale, 0 to 500, used by most international air quality apps.
PM2.5. Fine particulate matter 2.5 micrometres or smaller, small enough to reach deep into the lungs. The dominant pollutant in wildfire smoke.
Ground-level ozone. A secondary pollutant formed when nitrogen oxides and volatile organic compounds react in sunlight. It peaks on hot, still afternoons.
MERV (Minimum Efficiency Reporting Value). The ASHRAE 52.2 scale rating how effectively a filter captures particles from 0.3 to 10 micrometres.
Transboundary pollution. Air pollution crossing a political border, such as ozone precursors carried into Ontario from upwind US sources.
Written by Michelle Wan, Brand Manager and Air Quality Writer at Filterbuy. Michelle works directly with the manufacturing teams that build the filters described here, so her guidance reflects how filters are built and used rather than spec sheets.
Technically reviewed by David Clark, Licensed HVAC Technician.
Published: 26 August 2026. Updated: 26 August 2026