
St John's Real-Time AQI Tracker
What's Actually In St John's Air Today?
What High AQI Means for Your Lungs in St John's
How to Read AQI
The Air Quality Index (AQI) measures how polluted the air is and how it may affect your health.
0–50 (Good): Air quality is satisfactory.
51–100 (Moderate): Acceptable, but some pollutants may pose minor concerns.
101–150 (Unhealthy for Sensitive Groups)
151–200 (Unhealthy)
201–300 (Very Unhealthy)
301+ (Hazardous)
Moderate
Still okay for most, but if you have asthma or allergies, take it easy and avoid long outdoor workouts.
Shop MERV 11 filters→What's the Right Filter for Your AQI Level?





Check Today's Live Real Time Air Quality Index AQI Map in St. John's, NL Now
The live map above shows current conditions for St. John's and refreshes through the day. Two things are worth reading, the number and the pollutant driving it. Newfoundland and Labrador uses the Air Quality Health Index, a 1 to 10+ health risk scale, so the figure will not match the 0 to 500 AQI an American app shows for the same hour.
TL;DR: Quick Answers
Today's air: read the number on the map. Low risk is 1 to 3, moderate 4 to 6, high 7 to 10, very high above 10.
Two scales: Canada reports the AQHI (1 to 10+), global apps the U.S. style AQI (0 to 500). Both rise as air worsens.
Where it comes from: one provincial station on Water Street, updated hourly.
Why it spikes: wildfire smoke, sometimes from across the country and sometimes from the edge of town.
Indoors: close the windows, keep air moving through a filter, and run a portable HEPA unit if you have no ductwork.
Top Takeaways
Checked against the federal summary, St. John's is one of only five communities in the province with a published AQHI reading. The others are Corner Brook, Grand Falls-Windsor, Burin and Labrador City.
The index is calculated hourly from ozone, fine particulate and nitrogen dioxide measured at the Water Street station.
Ozone here peaks in late winter and early spring rather than summer. That held in both 2024 and 2025.
In 2025 the station broke the fine particulate standard 50 times, all in August, traced by the province to the Paddy's Pond wildfire at the city's edge.
About 60 per cent of Newfoundland and Labrador households heat with electric baseboards and only 14 per cent have a forced air furnace, so most homes here have no filter slot at all.
How to Read the Live Map for St. John's
Find St. John's on the map, read the number, then check which pollutant is behind it. Environment and Climate Change Canada publishes an hourly observed value alongside forecast maximums for tonight and tomorrow. The number tells you how much care your lungs need outdoors over the next few hours.
Two habits make it useful. Watch the trend rather than a single reading, which the weather office makes easy by posting past 24 hour and next 24 hour views beside the current value. Then look at the cause, because a 4 from drifting smoke and a 4 on a bright April morning call for different decisions indoors.
The same agency cautions that real time data arrives too fast for detailed quality control, so use it to plan the next few hours rather than as a measurement of record.
What Each AQHI Band Means for Your Day
The bands below are the federal health messages that accompany every Canadian reading, built around risk rather than one pollutant concentration.
Health messages as published by Environment and Climate Change Canada for the Air Quality Health Index.
Where St. John's Air Quality Is Actually Measured
The city's reading comes from one station on Water Street, near the Convention Centre. It measures sulphur dioxide, nitrogen oxides, carbon monoxide, ozone, PM2.5 and PM10 continuously, and doubles as the province's reference site, sampling volatile organic compounds one day in six. No published table puts the provincial monitors side by side, so Filterbuy Canada took the coordinates from the 2025 Air Quality Monitoring Report and worked the distances out.
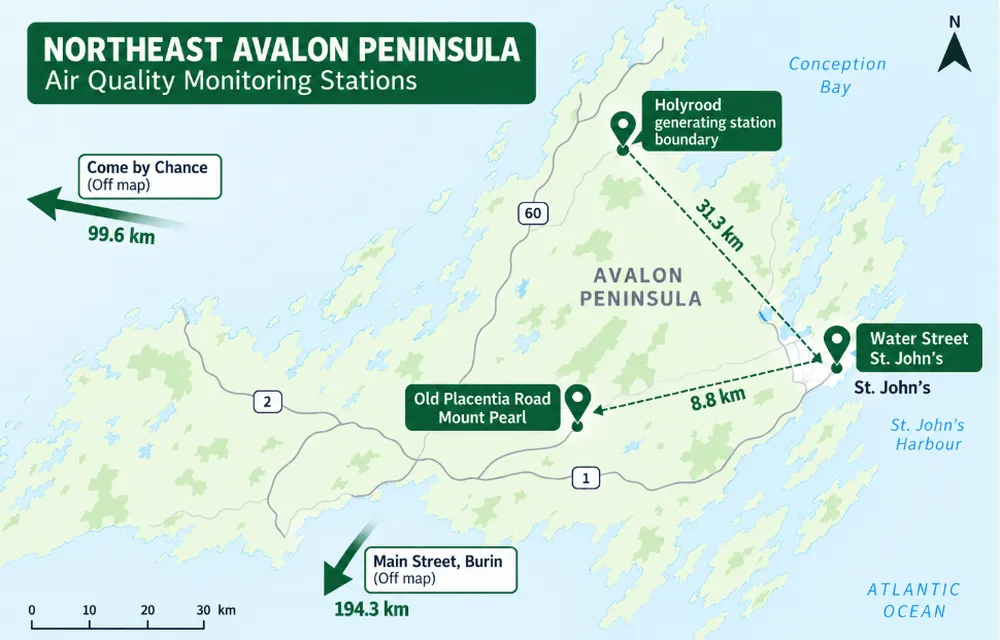
Distances calculated using the haversine formula from station coordinates published in Table 2.3.1 of the Newfoundland and Labrador 2024 Air Quality Monitoring Report.
Those gaps matter. Working through the same report, we found no monitor in Conception Bay South, the Goulds, Torbay or Portugal Cove, and none along the Outer Ring Road. On a still evening when a neighbour is burning wood, the air in your driveway can be worse than the harbour reading suggests.
What Is Actually in the Air Over St. John's
Marine air sets the baseline. Prevailing flow reaches the Avalon off the North Atlantic, and the province recorded an annual fine particulate average at Water Street of 4.6 micrograms per cubic metre in 2025 against a limit of 8.8.
Ozone is the part that surprised us. In most Canadian cities it is a hot weather problem. Reading down the monthly tables for Water Street, the highest averages fall in February, March and April in both 2024 and 2025 and the lowest in late summer, because the ozone reaching Newfoundland is background air carried across the ocean rather than smog formed locally.
Nitrogen dioxide is the local signal. The Water Street annual average of 3.4 parts per billion in 2025 was the highest of the five provincial stations and more than four times the Mount Pearl figure, which fits a monitor beside downtown traffic and a working harbour. The province names traffic, forest fires and woodstoves as its local sources.
When Smoke Reaches the Avalon
Smoke produces the worst air St. John's gets. What changed in 2025 was where it came from. In 2024 the exceedances were PM10 only, they fell in April and May, and the province put them down to wildfire smoke. In 2025 the station broke the fine particulate standard 50 times and the PM10 standard 30 times, all inside August, and traced every one to Paddy's Pond, burning at the city's edge. The AQHI peaked at 9.4 that month, against 4.1 for all of 2024.
Mount Pearl complicates the picture. Just 8.8 km from Water Street, it logged 81 fine particulate exceedances to St. John's 50, and its AQHI peaked at 16.4. Same fire, same weeks, two monitors a short drive apart, very different numbers. When smoke is local, the map is reporting a single street. When a plume moves in from away, our live air quality map for Canada shows the wider picture.
Where to Check the Forecast and Alerts
The federal AQHI page for St. John's carries the current value and forecast maximums. The provincial summary shows all five communities at once, separating a local effect from a province wide one. Special air quality statements appear on the public alerts page.
Supporting Statistics
Three findings from U.S. federal research sit behind the advice above.
55 to 60 per cent. With windows shut and no portable cleaner running, indoor fine particulate during a smoke event settles at 55 to 60 per cent of the outdoor level, ranging from 30 to 100 per cent across homes. Closing up is a partial measure. Source: EPA, Strategies to Reduce Exposure Indoors.
52 per cent. Wildland fires produced 52 per cent of all fine particulate emitted in the United States in the 2020 National Emissions Inventory. Source: EPA, Wildland Fire Research.
90 per cent. People spend roughly 90 per cent of their time indoors, where some pollutants run 2 to 5 times higher than outdoors. An outdoor reading calls for an indoor response. Source: EPA, Report on the Environment.
When Your Home Has No Ductwork
This is where advice written for Toronto stops working. About 60 per cent of households here heat with electric baseboards and only 14 per cent run a forced air furnace. Most homes have no filter to upgrade. No ducts, no filter slot.
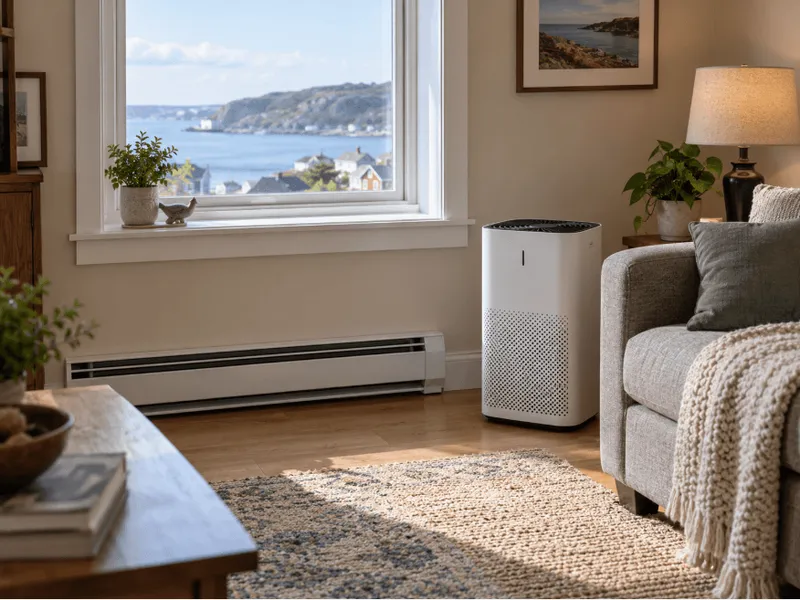
If that describes your house, a portable HEPA cleaner sized for the room you use most does more on a smoky day than anything else. Sealing helps too. Close the windows on the windward side and switch off bathroom and kitchen fans once smoke arrives, since they pull outdoor air in through gaps. A ductless heat pump is no substitute, since the washable screens in a mini split protect the coil rather than fine particles. Filterbuy Canada carries filters rather than air cleaners, so take that as the straight answer it is.
Our Take on a Low Index City
Put the last two years side by side. In 2024 the Water Street monitor cleared the fine particulate standard for the entire year. In 2025 it broke that standard 50 times inside a single August. Nothing about the city changed. What changed was whether anything was burning nearby.
Most air quality advice is written for cities with furnaces. Newfoundland is not one of them. For the majority of homes here the honest recommendation is not a better filter, it is a portable cleaner in the room you actually sit in, and we would rather say that than sell past it.
Filterbuy Canada
Matching a Filter to the Reading
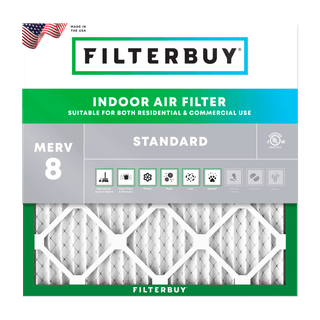
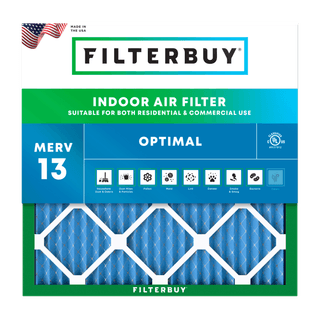
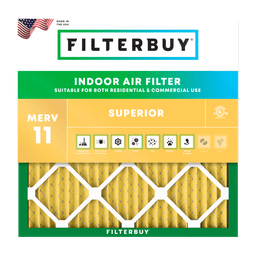
If you do have ductwork, match the filter to the risk rather than the season. On low risk days a MERV 8 filter handles dust, lint and pollen. On moderate days, MERV 11 captures finer dust and dander. When smoke is forecast, MERV 13 is the level that catches fine smoke particles, and a carbon filter addresses the smell that settles into a closed up house.
One caveat on compatibility. Higher rated media restricts airflow, and older equipment or an undersized return can struggle with it. Our guide to MERV ratings explains the trade-off. If airflow drops or the system short cycles, step back down and run a portable cleaner instead. Filterbuy Canada ships free across the country and stocks over 600 sizes, plus custom sizes for older returns, so finding your size and adding a subscription takes five minutes.
Frequently Asked Questions
Glossary
AQHI (Air Quality Health Index): Canada's official scale, 1 to 10+, based on the combined health risk from ozone, fine particulate matter and nitrogen dioxide.
AQI (Air Quality Index): the American 0 to 500 scale used by most global apps, set by whichever pollutant is worst at the time.
PM2.5: particulate smaller than 2.5 microns, about a thirtieth the width of a human hair, small enough to reach deep into the lungs.
MERV: the 1 to 16 rating for how much fine particulate a furnace filter captures. Higher numbers catch smaller particles and restrict airflow more.
HEPA: a grade capturing at least 99.97 per cent of particles at 0.3 microns, used in portable cleaners rather than ductwork.