
Air Quality in Newfoundland and Labrador
Air quality index (AQI⁺) and PM2.5 air pollution in Newfoundland and Labrador •
Live Air Quality Ratings in Newfoundland and Labrador
Live city rankings are temporarily unavailable.
The Right Air Filter For High AQI Days
When outdoor air quality drops, the EPA recommends upgrading to a MERV 13 filter — or the highest-rated filter your HVAC system can handle — to help capture more of the fine particulate (PM2.5) that comes with poor air quality. MERV 13 is the highest rating most residential systems can run without restricting airflow.
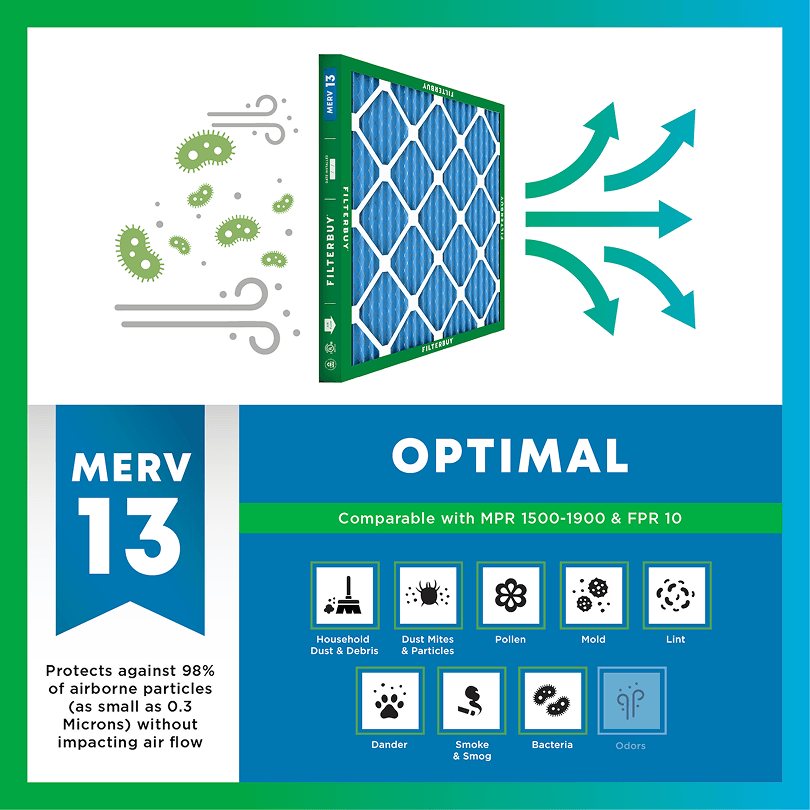

- Captures PM2.5 and other fine particulates
- Filters ash, soot, and smoke particles
- Rated to capture particles as small as 0.3 microns
- Matches the filter rating the EPA suggests during high-AQI and smoke events

AQI FAQs
What is AQI?
AQI stands for Air Quality Index, the EPA's scale for reporting daily air quality. It runs from 0 to 500. The higher the number, the greater the level of air pollution. Values at or below 100 are generally considered satisfactory; values above 100 mean air quality is unhealthy, first for sensitive groups, then for everyone as numbers climb.
What does AQI measure?
The AQI tracks five major pollutants regulated by the Clean Air Act: ground-level ozone, particle pollution (PM2.5 and PM10), carbon monoxide, sulfur dioxide, and nitrogen dioxide. The reported AQI value reflects whichever pollutant is highest at that time — most often ozone or fine particles (PM2.5).
How is AQI calculated?
Monitoring stations measure pollutant concentrations, and the EPA converts each into a standardized 0–500 score using set breakpoints. Each pollutant gets its own sub-index, and the highest sub-index becomes the reported AQI. That's why a single number can represent different pollutants on different days.
What is a good AQI?
An AQI of 0–50 is rated "Good" — air quality poses little or no risk. 51–100 is "Moderate," acceptable for most people though unusually sensitive individuals may want to limit prolonged outdoor exertion. Anything at or below 100 is generally considered satisfactory air quality.
What does an AQI of 100 (or 150) mean?
100 is the dividing line: at or below it, air quality is satisfactory for the general public. From 101–150, air is "Unhealthy for Sensitive Groups" — people with respiratory conditions, older adults, and children. From 151–200, it's "Unhealthy" and everyone may begin to feel effects.
Why is the AQI bad today?
Short-term AQI spikes usually come from wildfire smoke, temperature inversions that trap pollutants near the ground, high-ozone weather (hot, sunny, stagnant days), or heavy traffic and industrial activity. Check a real-time source like the map on this page to see which pollutant is driving today's reading in your area.
What AQI is bad for running or exercise?
Many runners follow the EPA category lines: below 50, no adjustment needed; 51–100, unusually sensitive people may shorten intense workouts; above 100, sensitive groups are advised to reduce prolonged or heavy outdoor exertion; above 150, that advice extends to everyone. Exercise increases how much air you breathe in, which is why thresholds matter more during workouts.
What AQI is safe to open windows?
A common rule of thumb is to keep windows open when the AQI is under 100 and close them when it climbs above, especially during wildfire smoke events when fine particles are elevated. When windows are closed, running your HVAC system with a fresh filter helps capture particles circulating indoors.
Should I wear a mask based on AQI?
Public health agencies generally suggest considering a well-fitted N95-style respirator outdoors when the AQI exceeds 150, particularly during smoke events. Cloth and surgical masks don't filter fine particles effectively. Follow guidance from your local health department, which may adjust recommendations during severe episodes.
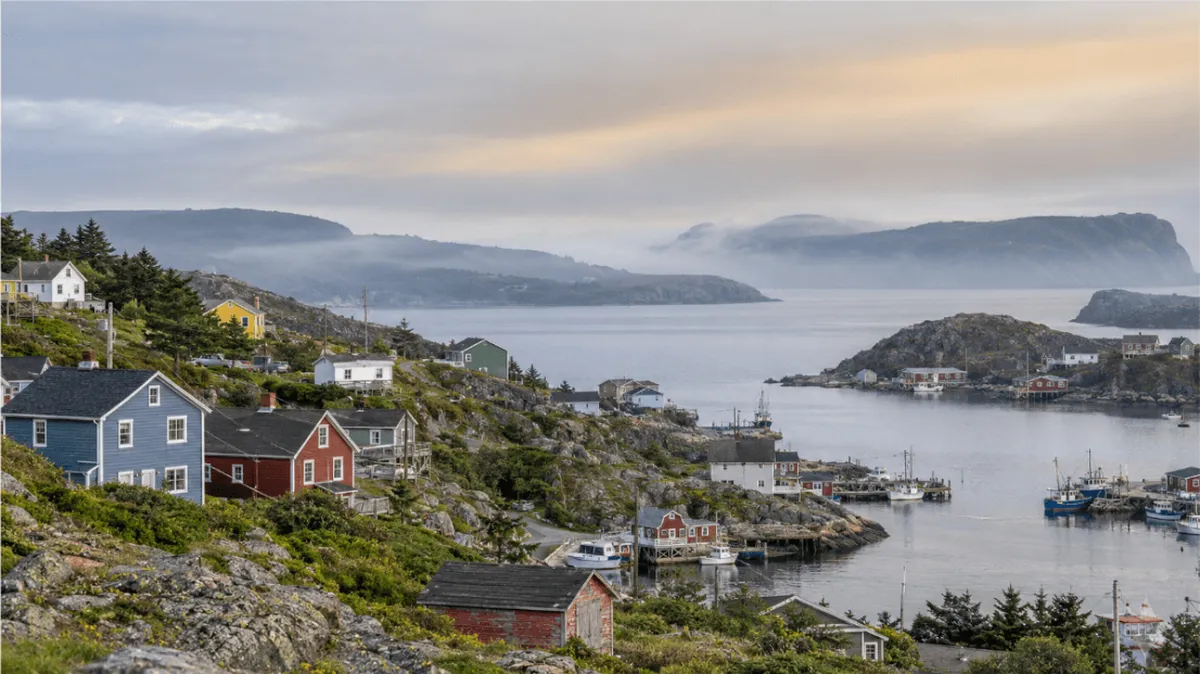
Check Today's Live Real Time Air Quality Index AQI Map in Newfoundland and Labrador Now
The live AQI map above shows real time air quality across Newfoundland and Labrador. Find the community closest to you. Most days the current air quality here sits in the low health-risk range, more often than almost anywhere else in Canada. The exception is wildfire smoke, which can carry a reading from clean to unhealthy in a single afternoon. Here is how to read that number and what to do indoors.
TL;DR
Air here is among the cleanest in Canada. The provincial government states plainly that the AQHI is usually in the Low range for the province. Smoke is the one thing that reliably changes that, whether from a fire in Labrador or one burning a thousand kilometres upwind in Quebec. Because readings are published for only five communities, the live air quality map is a regional signal rather than a measurement of your street, and that gap is why indoor filtration ends up being the part you control.
Key Takeaways
Environment and Climate Change Canada publishes Air Quality Health Index (AQHI) values for five communities: St. John's, Burin, Grand Falls-Windsor, Corner Brook and Labrador City.
In 2025 the AQHI at the province's reporting stations sat below 3 for roughly 98.8% to 99.9% of measured hours.
Wildfire smoke pushed most stations past the 24-hour fine particulate standard in August 2025, with Mount Pearl peaking at 89.7 micrograms per cubic metre against a 25 microgram standard.
Fine particulate from smoke follows you indoors. Ozone largely breaks down inside. That difference decides which action helps.
Reading the Live Map, and Why It Shows AQI When Canada Reports AQHI
The map reads conditions at fixed monitoring stations and shades the ground around them, so the value you see is a snapshot of the hour just gone rather than a forecast of the day ahead. When it starts climbing, the useful question is what is driving it, because a smoke-driven number behaves quite differently from a traffic-driven one.
Canada does not use the American Air Quality Index. The Air Quality Health Index is a health-risk scale from 1 to 10+, calculated hourly from ozone, fine particulate matter (PM2.5) and nitrogen dioxide, and run jointly by Environment Canada, Health Canada and the provincial environment and health departments. Many live maps convert those same readings onto the 0-to-500 AQI scale, which is why a PM2.5 AQI of 30 and an AQHI of 2 can describe the identical hour of air. Both mean the air is clean.
I read smoke maps for a living, and this scale mismatch trips people up more than any pollutant does. Someone sees AQI 30 on one map and AQHI 2 on another and assumes one is broken. Both are saying the same thing. What matters is which station the number came from, and in this province that station can be a long way off.
Michelle Wan, Brand Manager and Air Quality Writer, Filterbuy
At-risk groups include people with asthma, COPD or heart conditions, older adults, young children, people who are pregnant, and anyone working outdoors. Source: Environment and Climate Change Canada, Air Quality Health Index.
Why the AQI Map May Not Match What You're Breathing
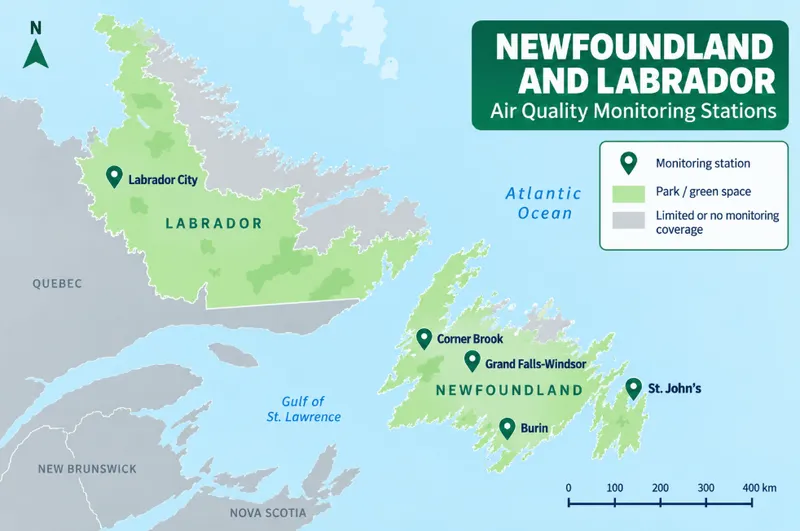
Every live air quality map for this province carries the same limitation. Readings are published for five communities across more than 400,000 square kilometres, four of them on the island. Labrador accounts for roughly 72% of the land area and gets a single station, mounted at the Labrador City fire hall, which began life as an industrial monitor for the iron ore operation next door.
The gap leaves Happy Valley-Goose Bay, Churchill Falls, coastal Labrador and the Northern Peninsula with no published AQHI value of their own. Your nearest reading might sit hundreds of kilometres away with different wind and terrain in between, and smoke travels in bands rather than even sheets, so a station forty kilometres upwind can read clean while your valley fills. Take the map as your regional signal and let your eyes and nose handle the last few kilometres.
What Gets Into the Province's Air, and Where It Comes From
Three sources account for most of what the monitors pick up here, and they behave differently enough that knowing which one you have changes what you should do about it.
Wildfire smoke drives most of the poor air days, arriving from nearby fires and from fires thousands of kilometres away. Prevailing winds run west to east across the country, putting this province downwind of Quebec, Ontario and the Prairies for the whole of their fire seasons.
Residential wood burning counts for more here than in most of the country, which follows from how people heat. Statistics Canada found households outside Canada's large cities are four times as likely to own a heating stove, and 88% of those stoves burn wood. The provincial report names woodstoves alongside vehicle traffic as a recurring local influence, and on a still cold night a neighbour's chimney is a real particulate source.
Industrial operations are watched through a separate network: seven on the island and four in Labrador as of 2025, covering the iron ore operations at Labrador City and Wabush, Corner Brook Pulp and Paper, Braya at Come by Chance and Vale's sites. Elevated readings there usually come down to fugitive dust lifting off the ground rather than anything from a stack, and spring street sweeping in Labrador West adds to it.
The Newfoundland Spring Ozone Pattern Most People Miss
Almost everywhere else in North America, ozone is a summer problem cooked up by heat and traffic. The provincial record for 2025 puts every one of the year's ozone exceedances in February, March and April instead: eleven at Port aux Choix, eight each at Corner Brook and Grand Falls-Windsor, and none across the summer. That timing points to ozone arriving on spring air flows rather than forming locally, which also means filtration will not help, since ozone breaks down quickly on indoor surfaces.
Smoke Season: The One Thing That Moves the Numbers Fast
The recent record makes this case better than any warning could. Wabush evacuated overnight in 2013 on air quality grounds alone, before flames reached the town. Environment Canada issued an air quality alert for Labrador in June 2023 as smoke from the Quebec fires spread east. Then came June 2024, when roughly 750 Churchill Falls residents were ordered out, and weeks later more than 9,600 Labrador City residents left in the largest wildfire evacuation in the province's history.
August 2025 left the clearest mark in the data. The St. John's station logged 50 hours in which the rolling 24-hour PM2.5 average sat above the province's 25 microgram standard, while Mount Pearl logged 81 of them, peaked at 89.7 and watched its three-hour AQHI touch 16.4, well inside the very high band. Corner Brook, outside the plume on the far side of the island, recorded no exceedances at all that year. One summer, one province, two different sets of air.
In late June 2026, a state of emergency in Labrador City came with a yellow-level air quality warning. During a fire, the province posts locations and status on the NL Active Wildfire Dashboard, updated from field assessments rather than in real time.
What a Yellow, Orange or Red Air Quality Warning Means for Your Day
Environment and Climate Change Canada added colour codes to all of its alerts on 26 November 2025, and air quality warnings now carry one. Because the colour reflects both expected severity and forecaster confidence, it tells you something the AQHI number alone cannot. Special air quality statements were retired in the same change, so the colour is now the signal to watch.
Yellow is the one you will see most often, covering impacts that are moderate, localized or short-lived. Close the windows, watch the AQHI, and move strenuous outdoor activity for anyone sensitive. The warning over Labrador City in June 2026 was a yellow. Orange signals significant impacts, spread widely and likely to run for days rather than hours, so plan for a multi-day event and leave the fan running. Red is rare, reserved for conditions that are genuinely dangerous and prolonged, and at that point provincial and municipal direction comes first, including any evacuation order.
Our Take: In Newfoundland and Labrador, Indoor Air Is the Part You Control
Nothing you do will decide whether a plume from northern Quebec crosses the Strait of Belle Isle. What you can decide is what happens to the air already inside your house while that smoke sits overhead.
Filterbuy has been building pleated filters since 2013 and shipping them to more than two million households, and that vantage point turns up the same sequence every fire season. Orders spike within hours of a fire igniting, precisely the moment shipping slows and the sizes people need begin running short. Whatever you use, the version that helps you is the one you already own.
The particles are about one-thirtieth the width of a human hair and stay airborne a long time, so they have to be captured rather than waited out. Where there is ductwork to do that, setting the fan to On rather than Auto matters as much as the filter itself, because a system left on Auto sits idle through most of a mild smoky day.
Most Homes Here Cannot Use a Furnace Filter at All
Newfoundland and Labrador is where most air quality advice quietly stops applying, and the reason is how the province heats its homes. Statistics Canada found that in 2021, 60% of Newfoundland and Labrador households heated with electric baseboards, the highest share in the country, while just 14% had a forced air furnace. Nationally the split runs the other way, at 51% furnaces to 25% baseboards. So filter advice written for the rest of North America does not reach most homes here, for the plain reason that there is no slot to put a filter in. The table below is for roughly one home in seven. The section after it is for the other six.
If Your Home Has Ductwork, Match the Filter to the Map
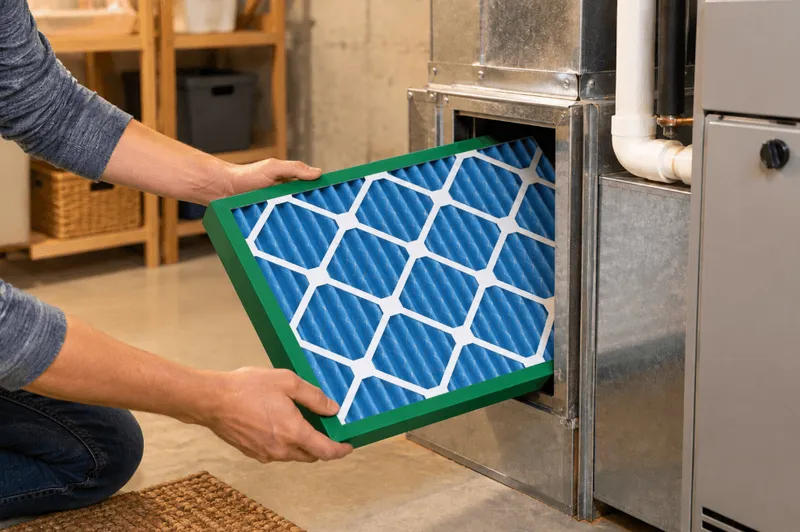
MERV 13 restricts airflow more than MERV 8 does. On an older or undersized system, check the equipment documentation or ask an HVAC technician first. No HVAC filter removes gases: carbon monoxide, radon and ozone pass straight through.
Two things before you upgrade. The Filterbuy guide to MERV ratings covers what your system can take, and running the blower non-stop carries a real energy and humidity cost worth knowing before a multi-day event.
Reviewer note, David Clark, Licensed HVAC Technician and CEO of Filterbuy HVAC
Solutions: the airflow worry is usually aimed at the wrong thing. Filterbuy testing lab data puts a clean MERV 13 at 0.22 to 0.28 inches w.g. against 0.08 to 0.12 for a MERV 8, and most residential systems are built to stay under 0.5 inches total. A dirty MERV 8 restricts airflow more than a clean MERV 13 does. The rating rarely chokes a system; a filter left in past its life does. Smoke loads media fast enough to turn a 90-day part into a 30 to 45 day part.
If You Heat With Baseboards, Which Is Most of This Province
Baseboards and wood stoves move no air through anything, so the job changes from treating a house to defending one room. Choose the space with the fewest windows and doors, usually a bedroom, and run a portable HEPA cleaner sized for it continuously rather than in bursts. The trade-offs against an HVAC filter come down to cost per square foot, and for a single room the portable unit wins outright. Choose one that produces little or no ozone. For errands at a high AQHI, a well-fitted N95 beats any indoor measure. Filterbuy sells furnace filters for a living, so take this as plainly as we mean it: if that describes your home, a furnace filter is not your answer.
Whichever of those homes is yours, what helps is whatever is already on the shelf when the smoke arrives. Filterbuy builds MERV 13 pleated filters in over 600 sizes plus custom sizes, shipped free across Canada from Filterbuy.ca, and auto-delivery keeps that spare on hand. Once the air clears, our checklist for recovering from smoke exposure covers what settles indoors afterwards.
Supporting Statistics
Canadian smoke, measured south of the border. Across 19 smoke days between 30 April and 4 August 2023, asthma-associated emergency department visits at roughly 6,000 U.S. hospitals ran 17% higher than expected (CDC MMWR).
Closing up is not enough. Indoor PM2.5 still reaches 55% to 60% of outdoor levels in a sealed house with no air cleaner running, while running a central system continuously cuts particle concentrations by about 24% even with an ordinary filter (U.S. EPA).
Exposure and vulnerability overlap. People spend roughly 90% of their time indoors, where some pollutants run two to five times outdoor levels, and those most susceptible to air pollution spend even longer inside than average (U.S. EPA Report on the Environment).
Frequently Asked Questions
Glossary
AQHI (Air Quality Health Index): Canada's official air quality scale, 1 to 10+, calculated hourly from ozone, PM2.5 and nitrogen dioxide.
AQI (Air Quality Index): The U.S. scale, 0 to 500. Many live maps convert Canadian data to it.
PM2.5: Fine particulate 2.5 microns or smaller, about one-thirtieth the width of a human hair. The main health concern in smoke.
MERV: Minimum Efficiency Reporting Value, the rating for air filter particle capture. Higher numbers capture smaller particles.
Sources
Environment and Climate Change Canada, Newfoundland and Labrador AQHI Summary: https://weather.gc.ca/airquality/pages/provincial_summary/nl_e.html
Government of Newfoundland and Labrador, Air Quality Health Index: https://www.gov.nl.ca/eccc/env-protection/science/aqhi/
Government of Newfoundland and Labrador, 2025 Air Quality Monitoring Report (May 2026): https://www.gov.nl.ca/eccc/files/2025-Air-Quality-Annual-Report.pdf
Health Canada, Health effects of wildfire smoke exposure: https://www.canada.ca/en/services/health/healthy-living/environment/air-quality/wildfire-smoke/health-effects-exposure.html
Environment and Climate Change Canada, About the AQHI: https://www.canada.ca/en/environment-climate-change/services/air-quality-health-index/about.html
Environment and Climate Change Canada, Colour-coded weather alerts: https://www.canada.ca/en/services/environment/weather/severeweather/weather-alerts/colour-coded-alerts.html
Government of Newfoundland and Labrador, Fighting Wildfires and the NL Active Wildfire Dashboard: https://www.gov.nl.ca/fal/wildfiremanagement/fighting-wildfires/
Statistics Canada, The heat is on: How Canadians heat their home during the winter (2021 data): https://www.statcan.gc.ca/o1/en/plus/2717-heat-how-canadians-heat-their-home-during-winter