Shop by
September 15, 2026
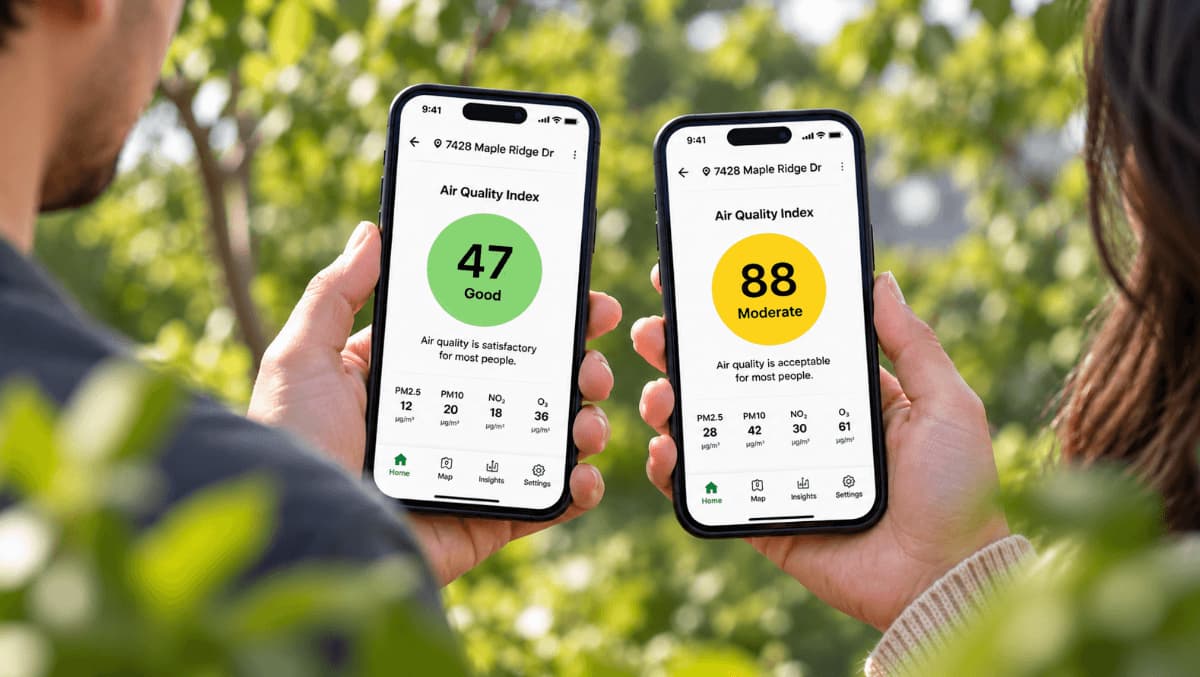
Two apps show different AQI numbers because they aren’t measuring the same thing. Each app picks its own data source, averaging window, pollutant, and index, and every choice moves the number.
Neither app is broken. In the U.S., use AirNow as your reference and treat the other apps as early warning.
Every one of those numbers describes outdoor air, so take the quick quiz below to match your home to the right filter.
Shop Air Filters at Filterbuy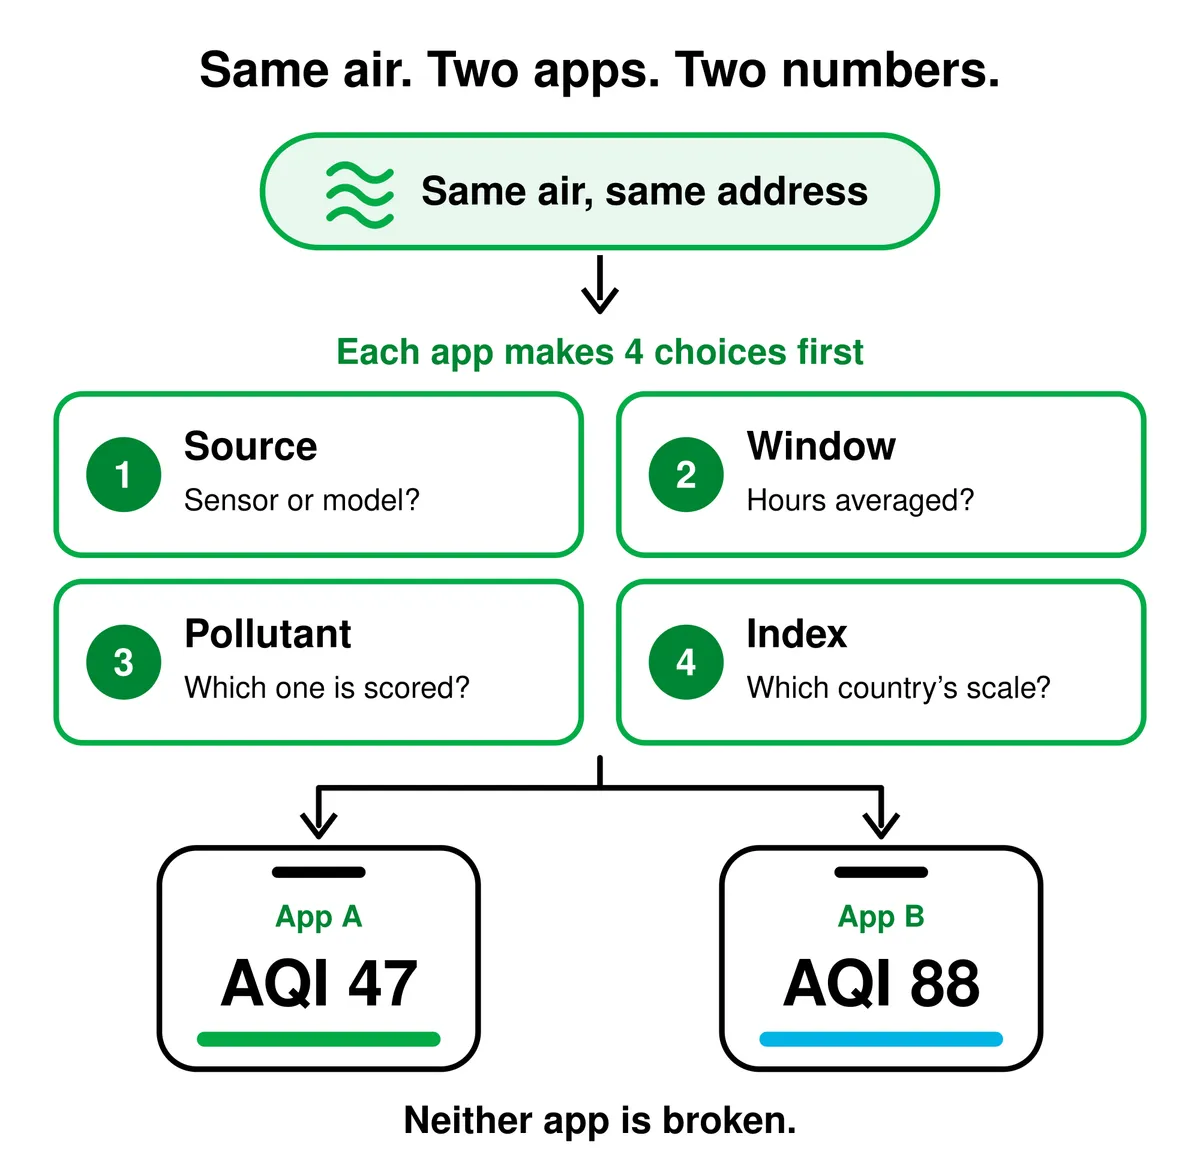
Answer a few quick questions and we’ll match you to your filter.
Already know your filter size? Shop filters at Filterbuy →
Two apps report different AQI numbers for the same address because they are not measuring the same thing. Four variables move the number: data source, averaging window, pollutant scored, and index converted to. Neither app is broken. In the United States, treat AirNow as your reference and the others as early warning.
The Filterbuy Four-Layer Divergence Model explains every discrepancy: data source, averaging window, pollutant, index. A 30-to-50-point gap is normal.
Google documents two separate U.S. EPA indexes, usa_epa and usa_epa_nowcast, so Google and AirNow can both be right and disagree.
Every number here describes outdoor air. Your filter decides what your family breathes.
AQI is a calculated score, not a direct measurement, and every app reporting one makes four choices first: where the data comes from, how many hours to average, which pollutant to score, and which index to convert into. Each choice moves the result, which is how two apps apply flawless math to the same air and land 40 points apart.
We built this framework at Filterbuy, a U.S. air filter manufacturer running a live national AQI map.
Work through them in order; most resolve at the first or second.
“Nobody writes to us on a clean-air day. The questions arrive when two screens disagree and somebody has to decide whether the kids play outside. What I tell them is that the disagreement is not the problem to solve. It is the first useful thing the apps have said.”
— Michelle Wan, Brand Manager and Air Quality Writer, Filterbuy
We watch these feeds side by side all day on the Filterbuy AQI map, and they plainly are not drawing from the same place. AirNow, run by the EPA and NOAA, publishes regulatory-grade monitor readings. Accurate, but thin: 988 active PM2.5 sites nationwide, about one per 250,000 people.
Commercial apps fill gaps with models. Google’s Air Quality API, which powers Google Search and Maps, blends monitor data with satellite readings, traffic, weather, and fire models to estimate any coordinate. Google bought BreezoMeter, the company behind it, in 2022; AccuWeather bought Plume Labs the same year.
Apple Weather and Google are less independent than they look. Apple’s own documentation names BreezoMeter as Apple Weather’s U.S. provider, and Apple’s source list points BreezoMeter at Google Maps Platform. One lineage, two apps, still disagreeing, because each picks its own index and window.
PurpleAir is a third category: crowdsourced laser sensors on private homes, closer to where people live and prone to reading high in smoke. EPA researchers found raw PurpleAir data overestimate PM2.5 by about 40%, so the EPA corrects it on the AirNow Fire and Smoke Map.
Apps disagree on timing because the AQI is an average and there are three legitimate windows to average over. The daily PM2.5 figure uses 24 hours, real-time reporting uses NowCast, and some apps show the latest hourly reading. In fast-moving smoke those three can sit a hundred points apart, all correct.
A raw 1-hour reading spikes the moment smoke arrives, NowCast follows behind, and the daily average trails both.
Rather than describe that gap, we measured it. We ran the EPA’s NowCast algorithm against one modeled smoke event, converting each result with the 2024 breakpoints. Six hours in, the same air scores 235 raw, 205 on NowCast, 84 daily.
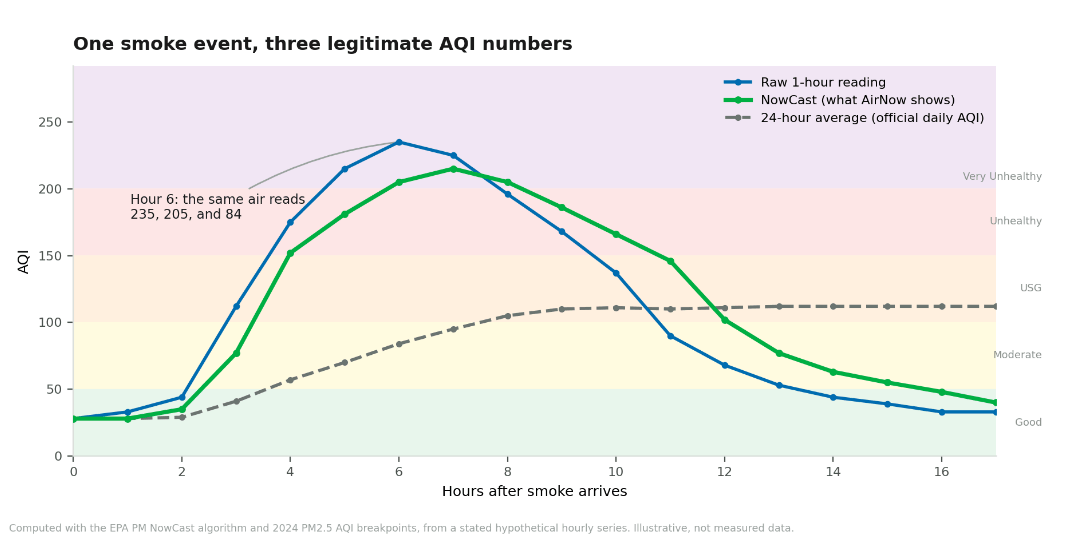
Filterbuy analysis, computed with the EPA PM NowCast algorithm and 2024 breakpoints from a stated hypothetical series. Illustrative, not measured data.
Here is the detail almost nobody covers, and it settles most "Google versus AirNow" arguments. Google’s Air Quality API documentation lists two distinct U.S. indexes, usa_epa and usa_epa_nowcast. Which one an app requests changes the number, though both are labeled "US EPA AQI." Same address, same standard, two answers.
The AQI is not a blend. The EPA scores five major pollutant categories as six sub-indices, since PM2.5 and PM10 score apart. The highest sub-index becomes the AQI, and that pollutant is called the dominant pollutant.
The AQI is a worst-case score, so an app tracking fewer pollutants reads lower. PurpleAir reports PM2.5 only, so when ground-level ozone dominates on a hot afternoon, a PM2.5-only app sits green while AirNow reports orange. Neither is lying; one is not looking at the right pollutant.
Read the dominant pollutant, not just the number. If ozone owns your reading, the cleaner hours are morning and evening. If PM2.5 owns it, keep particles out.
“On smoke days the phone rings about filters. On ozone days it does not ring at all, because somebody checked an app, saw green, and got on with the afternoon. Ozone is a gas. It does not smell like a campfire, and a pleated particle filter, ours included, does almost nothing to it. The honest advice is to move outdoor plans to the morning, not to buy a better filter.”
— David Clark, CEO of Filterbuy HVAC Solutions and Licensed HVAC Technician
The last variable is which country’s index an app converts into, and the scales do not interchange. The U.S. index runs 0 to 500 with higher meaning worse air, Google’s Universal AQI runs the opposite way, and India puts its cutoffs elsewhere. Reading one as another gives a number that means nothing.
Source: Google Air Quality API index documentation, 2026.
The inversion catches people out. On Google’s published index tables, 85 is nearly perfect, and Moderate on the U.S. scale. Categories diverge too: 101 to 150 is "Unhealthy for sensitive groups" here but "Moderate" under India’s NAQI.
One more: under the EPA’s 2024 particulate matter rule, effective May 6, 2024, the "Good" threshold dropped from 12 µg/m³ to 9 µg/m³, so an app on old breakpoints reads low. See how the AQI is calculated or AQI scale explained.
Use AirNow as your reference and the modeled apps as early warning. It is the official U.S. source, applies current breakpoints, and scores every pollutant. When someone sends us two screenshots, this is the sequence.
1. Check the scale. If one app is on a universal or non-U.S. index, the comparison is meaningless.
2. Check the pollutant. If one says ozone and the other PM2.5, you have your answer.
3. Take the higher number seriously, unless it is a raw low-cost sensor reading, which runs high by design.
One caveat: the gap itself is information. A 40-point gap means conditions are changing fast.
The right number also depends on the decision in front of you. The commonest mistake is checking current conditions in the morning to plan an afternoon.
Filterbuy framework, built from EPA definitions for NowCast, forecast, and daily AQI.
Check your reading on the Filterbuy live air quality map or on AirNow, and if it climbs, here is what to do during an air quality alert at home.
Every AQI figure on this page describes outdoor air. None measures the air inside your home, and the pattern we see is that people refresh the app and never open the return vent. The outdoor number tells you what is coming; your filter decides how much arrives. MERV 13 is the PM2.5 benchmark, so check your filter when the number climbs.
Three figures from U.S. federal and national health authorities.
The AirNow Fire and Smoke Map carries roughly 15,000 PM2.5 air sensors, up from 7,500 at launch in 2020. The regulatory network beside it numbers 988 sites, and the EPA treats sensors as supplemental.
Source: EPA, AirNow Fire and Smoke Map: Building Trust in Air Quality Sensors (2024)
129.1 million people, 38% of the U.S. population, live in counties with a failing grade for ozone, against 61.5 million for short-term particle pollution. The American Lung Association says ozone affects more people than any other pollutant.
Source: American Lung Association, State of the Air 2026: Ozone Trends
Americans spend roughly 90% of their time indoors, where some pollutants run 2 to 5 times higher than outdoors. The EPA also states that no nationwide network measures air quality inside homes or schools.
Source: EPA Report on the Environment, Indoor Air Quality
Why is the AQI on my weather app different from Google?
They use different data providers and averaging windows. Google documents two separate U.S. EPA indexes, one standard and one NowCast. Check that both use the U.S. EPA scale first.
Which AQI app is the most accurate?
For the United States, AirNow is authoritative: run by the EPA and NOAA, built on regulatory-grade monitors, current on EPA breakpoints. Modeled apps can be more precise far from a monitor.
Why does PurpleAir show a higher AQI than AirNow?
PurpleAir uses laser sensors whose raw data overestimate PM2.5 by roughly 40%, and it reports shorter averaging windows. The "US EPA" conversion applies the EPA correction, putting sensors in the right category 91% of the time.
Should I use the current reading or the forecast?
The current reading for the next hour, the forecast for anything further out. Ozone peaks mid-afternoon, so a green morning reading tells you little about 3 p.m.
Air Quality Index (AQI): The EPA’s 0-to-500 scale converting pollutant concentrations into a health rating.
AirNow: The official U.S. air quality platform, run by the EPA and NOAA.
NowCast: The EPA’s real-time AQI method, weighting the last 12 hours toward recent readings.
Dominant pollutant: The pollutant with the highest sub-index. It sets the reported AQI.
PM2.5: Fine particles 2.5 micrometers or smaller, from smoke, traffic, and wood stoves.
Breakpoints: The cutoffs mapping a pollutant level to an AQI category. The PM2.5 set changed in 2024.
Universal AQI (UAQI): Google’s global index, running 100 down to 0. Higher means better air.
Four-Layer Divergence Model: Filterbuy’s framework for diagnosing app disagreement: source, window, pollutant, standard.
MERV: The 1-to-16 scale rating a filter’s particle capture. MERV 13 is the PM2.5 benchmark.
U.S. EPA, Technical Assistance Document for the Reporting of Daily Air Quality (AQI)
Federal Register, Reconsideration of the NAAQS for Particulate Matter, effective May 6, 2024
General information, not medical advice. If you have a heart or lung condition, follow your clinician’s guidance on high-AQI days.
