Shop by
September 15, 2026
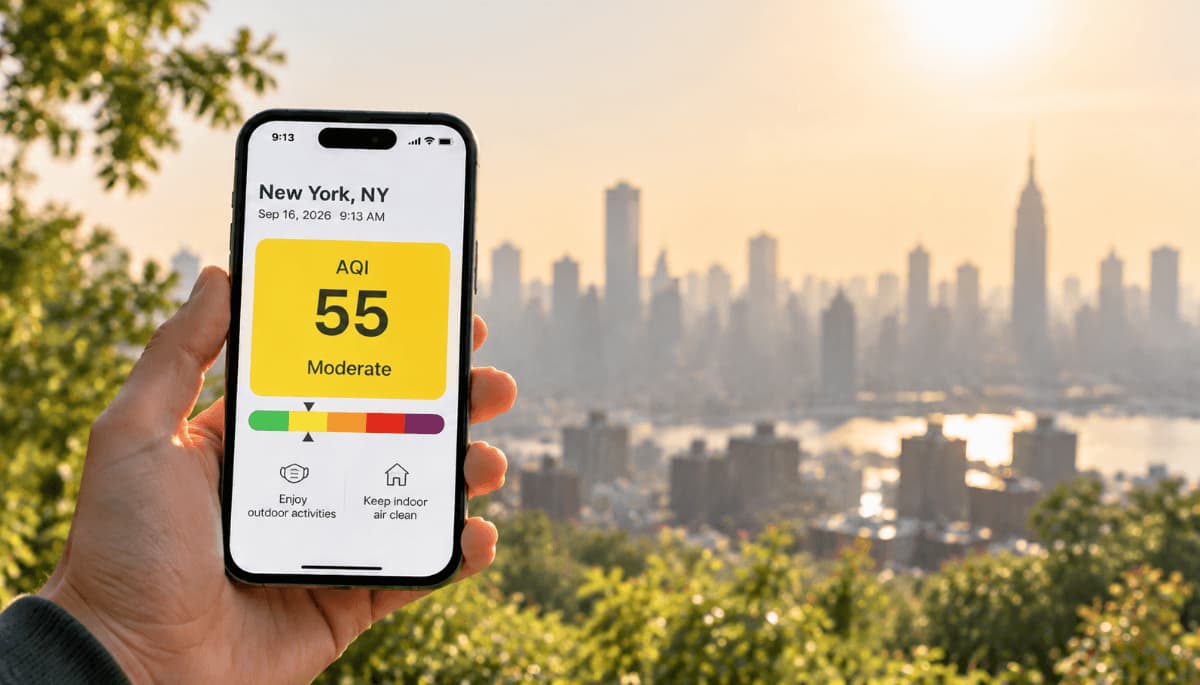
NowCast AQI is the EPA’s way of turning the past 12 hours of monitor readings into a current air quality number. When pollution changes fast, it leans on the most recent hours, so it reacts faster than a 24-hour average.
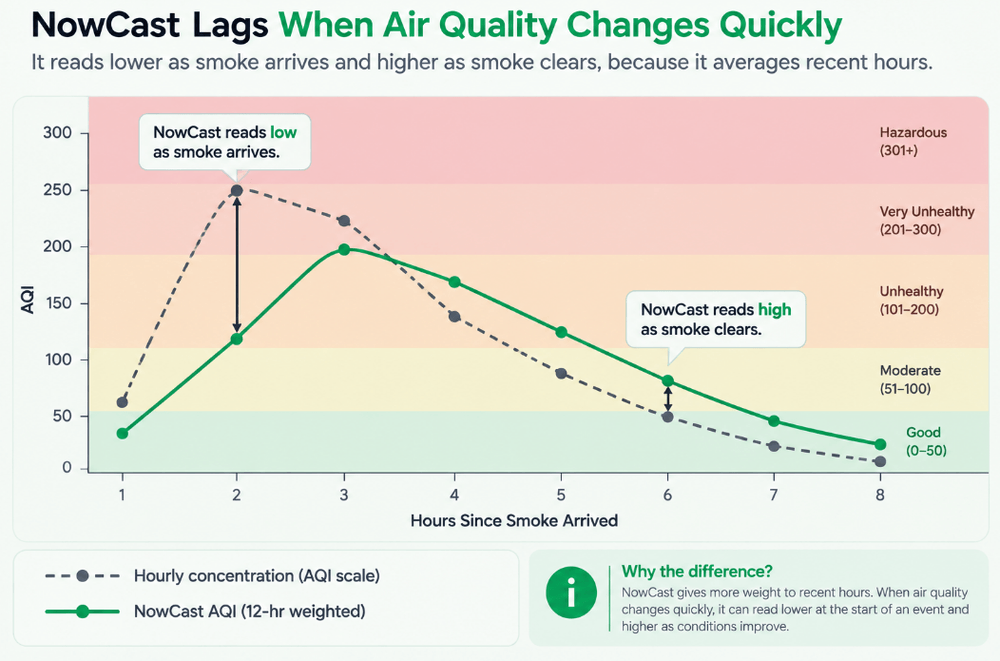
It still runs behind a moving smoke plume. It reads low as smoke arrives and high after it clears. If you can see or smell smoke, go by that, not the tile.
Getting your home ready for smoke season? Take the quick quiz below.
Answer a few quick questions and we’ll match you to the right filter for your home.
NowCast AQI is how the EPA reports current air quality on AirNow.gov, in the AirNow app and on most state and local air quality sites. Because the official AQI for particle pollution uses a 24-hour average, NowCast substitutes a weighted average of the past 12 hours, leaning on the most recent when pollution moves fast. That beats a daily average, but it still trails a plume arriving in under an hour and reads high for hours after one clears.
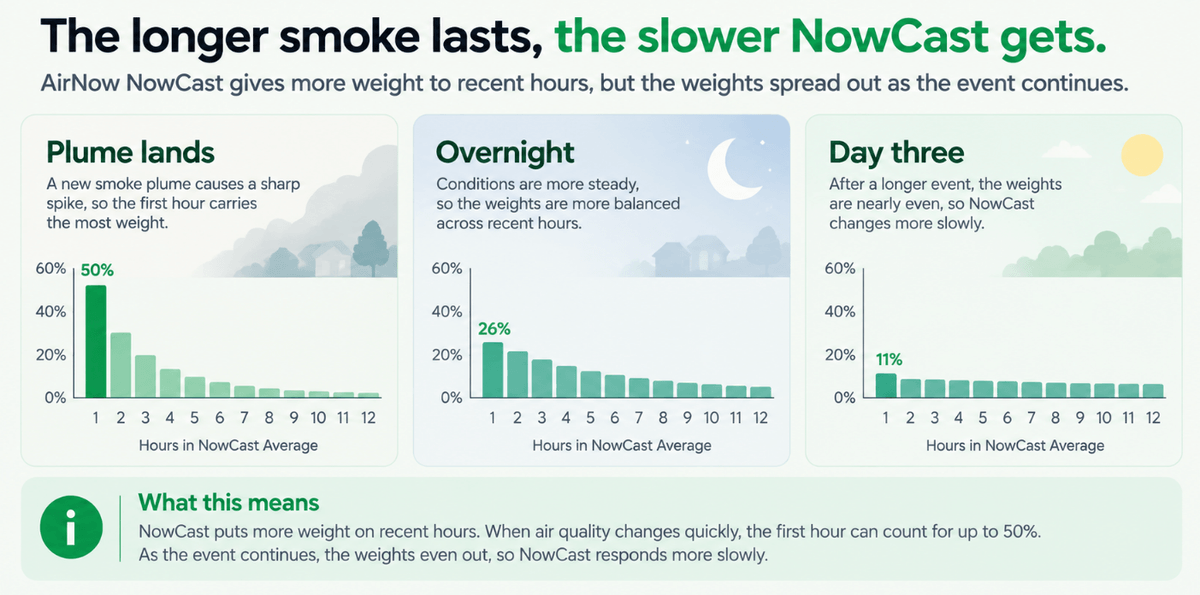
When air changes fast, NowCast behaves like a 3-hour average, the newest hour carrying about 50% and the last three about 88%.
When air is stable, it flattens toward a 12-hour average, about 8% per hour.
NowCast under-reads a plume arriving and over-reads it clearing. In our run the clearing side was the larger error.
NowCast slows as a smoke episode drags on. Day one, the last three hours drive 88% of the number; day three, 31%.
The AirNow Fire and Smoke Map is the better tool during a fire, adding thousands of sensors to regulatory monitors.
NowCast AQI is the EPA's method for turning hourly air monitor readings into a current Air Quality Index value. EPA runs two algorithms: one for particle pollution (PM2.5 and PM10), one for ground-level ozone. Anywhere you see "current air quality" on AirNow.gov, in the app or on a county dashboard, you are looking at a NowCast number.
The problem it solves: the daily AQI for fine particles uses a 24-hour average, midnight to midnight, because that is the exposure window the health research rests on, so today's true AQI is not known until tomorrow. EPA's AQI Technical Assistance Document is explicit that an AQI cannot validly be built from hourly data. But people still have to decide right now whether to send the kids to practice. NowCast bridges the two.
The PM NowCast multiplies each of the past 12 hourly readings by a weight factor raised to the power of how many hours ago it was recorded. That factor makes it adaptive. EPA gives the steps in its PM NowCast fact sheet; Filterbuy worked through them to see what the arithmetic does to a smoke reading:
Take the highest and lowest PM reading from the past 12 hours.
Divide that range by the highest reading for the scaled rate of change.
Subtract that from 1 for the weight factor, capped between 0.5 and 1.
Multiply each reading by the weight factor raised to the power of its age in hours, sum the products, divide by the sum of the weights and convert to AQI using EPA's breakpoints. AirNow has a concentration-to-AQI calculator for checking.
EPA also requires at least 2 of the 3 most recent hours of valid data, or no NowCast is produced. This has been the method since PM2.5 moved onto it on August 1, 2013 and PM10 on December 9, 2014.
Most write-ups stop at step 3, which is a shame, because a weight factor alone says nothing about what an hour is worth. Carried through the algebra, the steps collapse into something simpler. The weight factor is just the lowest hourly reading divided by the highest in the window. Subtracting the scaled rate of change from 1 is the long way of writing that ratio.
That gives a test you can run in your head: if the worst hour in the last twelve is at least double the best, NowCast is at its floor, its most responsive setting. Below that it slows proportionally.
That ratio produces a consequence Filterbuy has not found published anywhere. As smoke persists the ratio climbs, because the cleanest hour is no longer clean, so NowCast gets less responsive the longer an episode lasts.
Calculated by Filterbuy from EPA's published PM NowCast formula, floored at 0.50. We have not found these figures elsewhere.
So NowCast is sharpest in the first hours of a smoke event and dullest mid-episode. On day three, trust your senses more, not less.
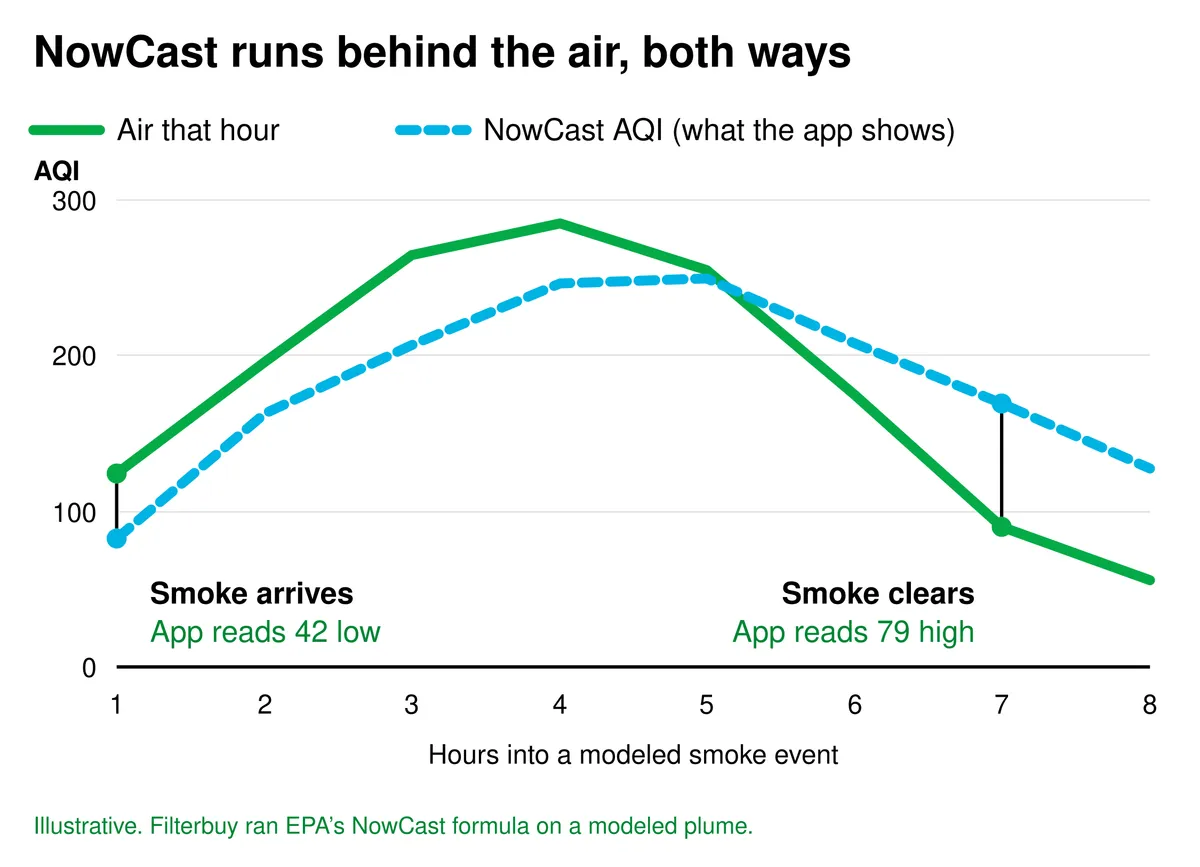
When a plume arrives fast, NowCast reads lower than the air you are breathing; when it clears it reads higher. To size that gap, Filterbuy ran EPA's formula against a modeled event: a clean morning at 6 µg/m³, then a plume rolling in and clearing over eight hours.
Illustrative only. EPA does not treat one hour of PM2.5 as a valid AQI value; this column applies the 24-hour breakpoints to the raw hourly reading purely to size the gap. Modeled, not field-measured.
We expected a lag on the way in, not a bigger one on the way out. NowCast's lag runs in both directions, and here the clearing side was worse: 42 AQI points behind as the plume arrived, 79 ahead as it cleared. At hour 7 the air has improved to Moderate while the tile still says Unhealthy.
That asymmetry is the part almost no one writes about. Wait for green before opening the windows and you wait hours too long; trust green as the plume lands and you open hours too early. Both come from the same formula.
NowCast lags because averaging is the point, not a bug. The AQI's health categories come from studies of 24-hour exposure, so a number built from one hour would not map onto them and its color would mean nothing. EPA accepted lag to keep it tied to a real health standard.
During a fast event, three delays stack:
The averaging window. Even at its most responsive it blends about three hours.
The reporting delay. Agencies validate before publishing. Spokane's air agency posts the completed hour at 35 minutes past, so a "current" reading can describe air from 90 minutes ago.
Monitor spacing. Plumes vary hugely over short distances. EPA notes monitors in one area can show different NowCast categories during smoke, and the nearest may be miles off (Fire and Smoke Map FAQ).
"The number and your nose are answering two different questions. NowCast is telling you what the last few hours averaged out to. Your nose is telling you what is coming through the wall right now. On a service call during fire season I go by what the filter looks like, not what the app says."
— David Clark, Licensed HVAC Technician
1. Asthma ED visits ran 17% above expected across 19 smoke days.
CDC found asthma-associated ED visits 17% above expected across the 19 days Canadian wildfire smoke reached the U.S. in 2023, with the biggest rises where it lingered. (CDC, MMWR)
2. In New York, the spike landed in one day.
On June 7, 2023, as PM2.5 peaked at 122.3 µg/m³ in the NYC metro, 1,229% above the 10-year June baseline, asthma ED visits rose 81.9%, from 80.8 to 147. The harm concentrated into hours, the window a 12-hour average smooths over. (CDC and NY State Dept. of Health, MMWR)
3. A high-efficiency filter with the fan on halves indoor PM2.5.
EPA puts indoor PM2.5 at 55–60% of outdoor levels with windows shut and no air cleaner. A high-efficiency HVAC filter with the fan on ON may cut that by about 50%; a low-efficiency filter run continuously, about 24%. (EPA)
If you can see or smell smoke, treat it as a smoke event whatever the tile says. Those hours matter most to EPA's sensitive groups: anyone with asthma, COPD or heart disease, plus children and older adults, who feel a plume before everyone else.
Check the AirNow Fire and Smoke Map, not the main dial. Thousands of corrected sensors put a reading nearer your block (AirNow explains why).
Watch the hourly PM2.5 trend, not the headline number. Direction beats value in a moving event: a rising trend under a "Moderate" NowCast means the worst is ahead. Filterbuy's live AQI map and wildfire smoke map both show it.
Close the house early. Windows and doors shut, fresh-air intake on recirculate, as EPA advises on wildfires and indoor air quality.
Run the HVAC fan continuously with a MERV 13 filter. Smoke is dominated by PM2.5, and MERV 13 is the highest efficiency most home systems handle without an airflow penalty. EPA recommends FAN ON over AUTO so air keeps cycling through the media. Unsure what yours takes? See our guide to MERV ratings.
Change that filter early. Here Filterbuy's manufacturing experience changes the advice. We build these filters in Talladega, Alabama, and our standard guidance is 90 days. In an active fire season we tell customers to plan on 30 to 45 days, because smoke loads media faster than anything else a home system sees. Find your filter size before the season, not mid-event.
Shop Filterbuy MERV 13 filters → · Check your local AQI →
Does ozone use the same NowCast as particles?
No. EPA implemented a separate ozone algorithm on August 1, 2019, using partial least squares regression across 1-hour and 8-hour data over a rolling two-week window (method and R code). Sulfur dioxide and nitrogen dioxide need none; their sub-indices already use 1-hour averages.
How often does NowCast update?
Hourly, but the hour shown has already closed. Spokane Regional Clean Air publishes it at 35 minutes past so data clears validation. Agencies differ, so check yours rather than assuming the tile is live.
Is NowCast AQI accurate?
NowCast is smoothed rather than inaccurate. It correctly reports a weighted multi-hour average of validated monitor data. In a fast plume that average is not the air in front of you, which is why it reads a category low on arrival and a category high as smoke clears.
Why does PurpleAir disagree with AirNow?
PurpleAir's default map does not apply NowCast, so it reacts faster. Low-cost sensors can also over-read smoke, which is why EPA corrects them on the Fire and Smoke Map.
AQI (Air Quality Index). EPA's 0–500 scale for outdoor air quality, in six color-coded categories from Good (green) to Hazardous (maroon).
NowCast AQI. EPA's calculation converting recent hourly monitor readings into a current AQI value.
Weight factor. Sets how heavily recent hours count. The window's lowest hourly reading divided by its highest, floored at 0.5. Lower means faster response.
PM2.5. Fine particulate matter 2.5 micrometers or smaller. Reaches deep into the lungs and dominates wildfire smoke.
MERV. Minimum Efficiency Reporting Value, the 1–16 scale for a filter's particle capture. MERV 13 captures a high share of PM2.5.
AirNow. EPA's public air quality reporting system: AirNow.gov, the app and the Fire and Smoke Map.
Fire and Smoke Map. AirNow's tool, run with the U.S. Forest Service, adding corrected sensor data to monitors.
U.S. EPA, Technical Assistance Document for the Reporting of Daily Air Quality (AQI), EPA-403/B-26-003, May 2026.
U.S. EPA, PM NowCast fact sheet, STI-6079.
U.S. EPA, O3-Nowcast methodology and R code, 2019.
U.S. EPA, Wildfires and Indoor Air Quality (IAQ).
