Shop by
September 15, 2026
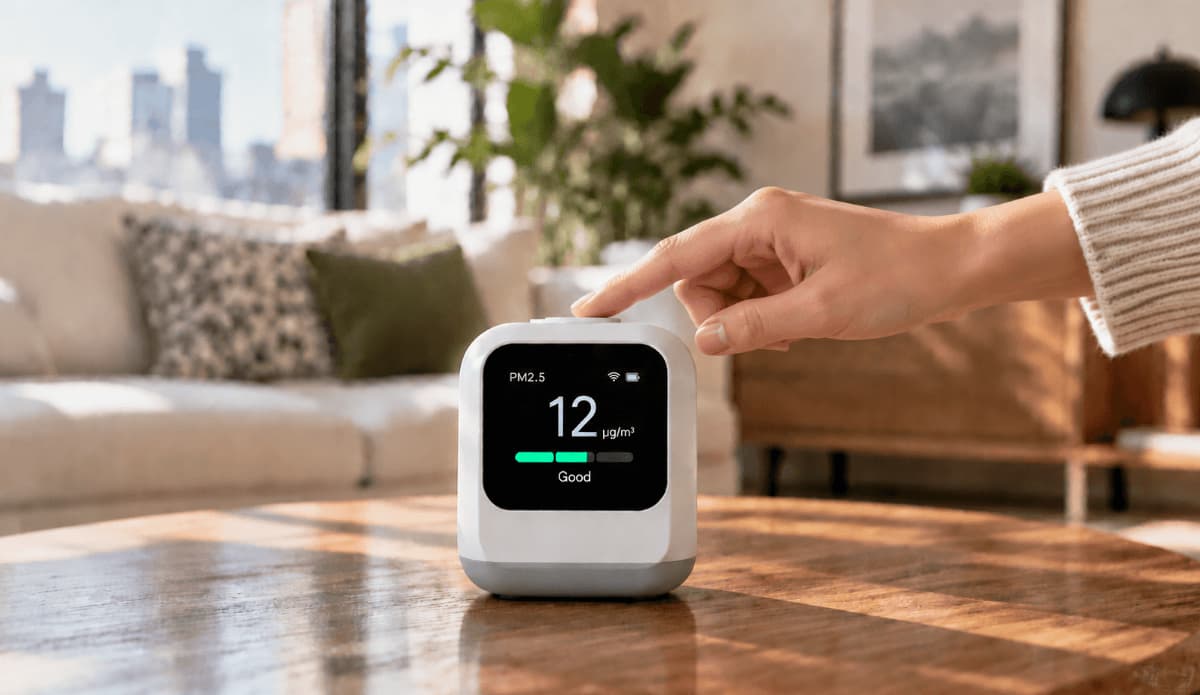
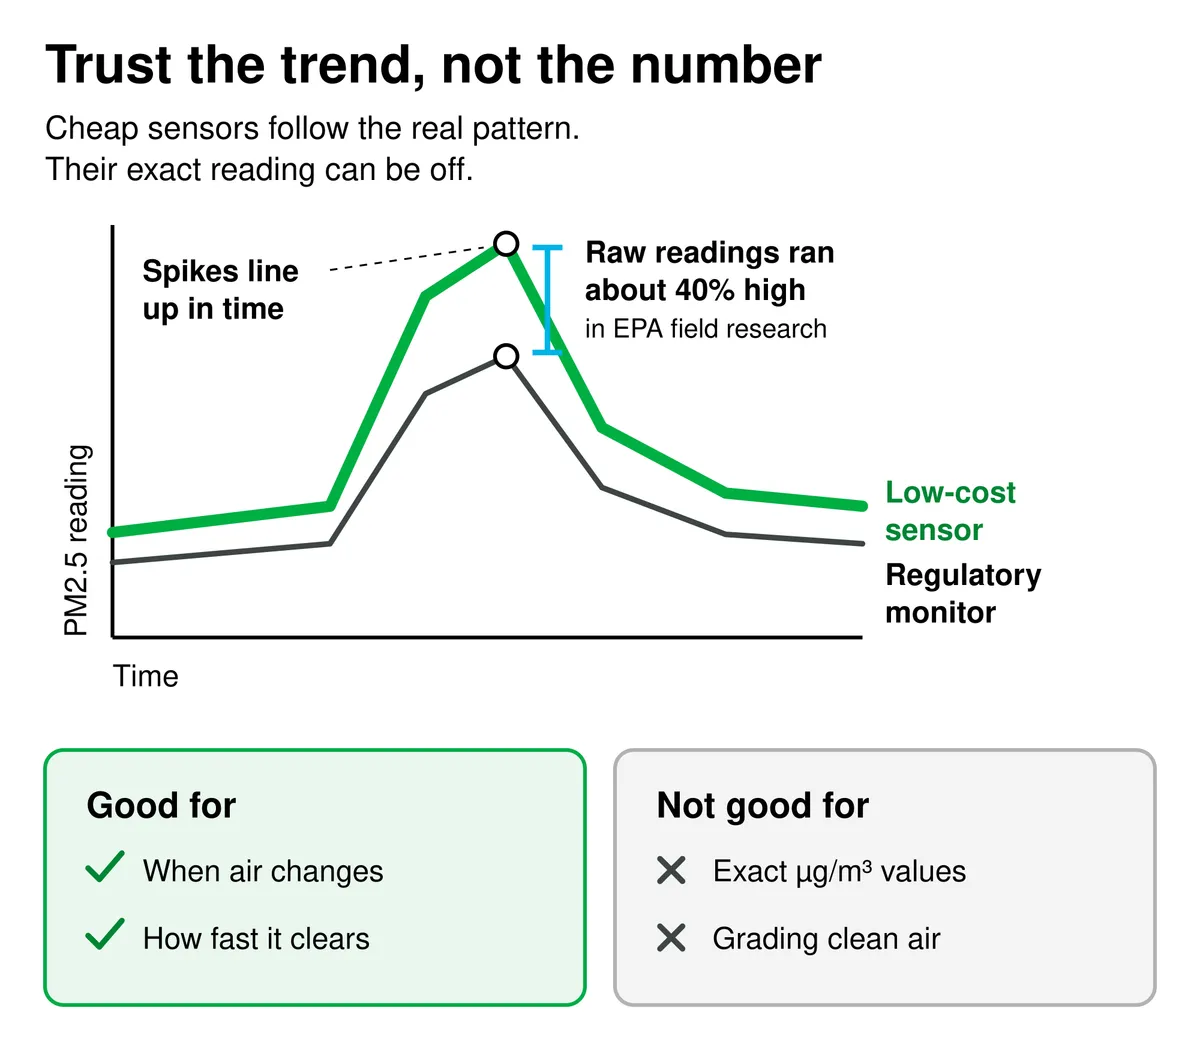
Low-cost air quality sensors are accurate enough to trust for direction and timing, and not accurate enough to trust as exact numbers. In EPA field research, corrected readings from PurpleAir, the most widely used consumer PM2.5 sensor, landed within about 3 µg/m³ of regulatory monitors, while raw readings ran roughly 40% high.
Use your monitor to see when your air changes. Then make sure the filter in your HVAC system is the right match for your home.
Not sure which filter fits your home?
Answer 3 quick questions and we'll match you to the right filter.
Already know your size? Shop air filters at Filterbuy
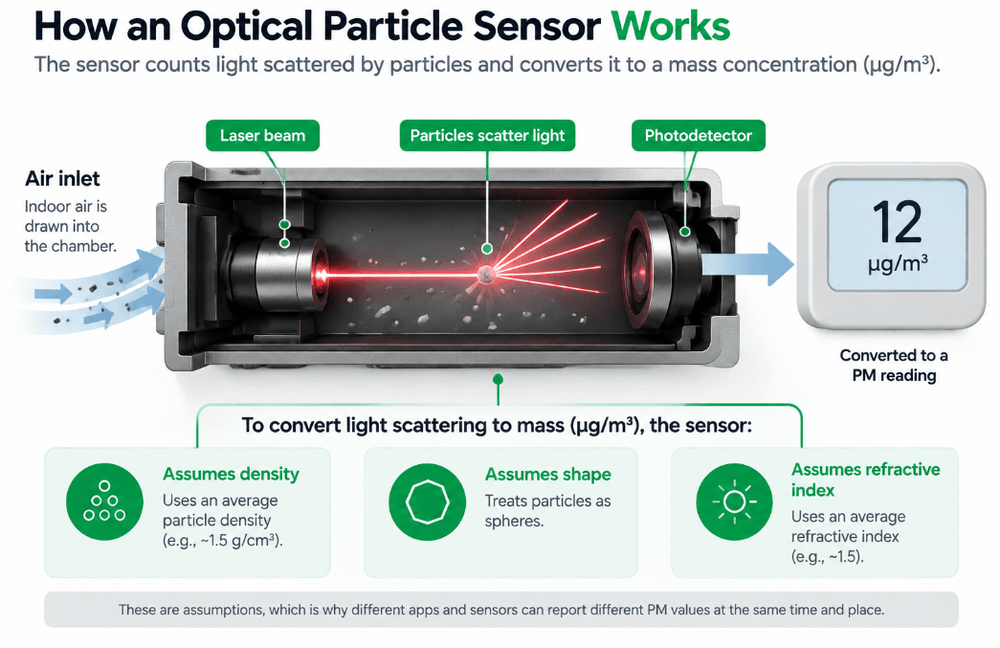
Consumer monitors estimate particle mass from scattered laser light rather than weighing anything, so every reading rests on assumptions about the particles. That makes them very good at spotting change and poor at reporting a concentration. It also makes them least accurate, proportionally, when the air is cleanest, where a reading of 2 and one of 5 amount to the same answer.
Raw PurpleAir readings overestimate PM2.5 by about 40%, across nearly 12,000 paired EPA measurements.
EPA’s correction cuts sensor error from about 8 µg/m³ to about 3 µg/m³.
Corrected sensors are proportionally least accurate when the air is cleanest: 54% normalized error below 10 µg/m³, against 12% at Very Unhealthy.
Humidity and dust bias readings in opposite directions: damp air reads high, dust reads low.
The EPA puts the limitation plainly in its own sensor-loan quality plan: air sensor data "is not necessarily accurate enough to calculate an AQI for health purposes."
Source: U.S. EPA Region 4, PM2.5 Sensor Loan Program Quality Assurance Project Plan, 2024.
"The question I get most is why the monitor and the phone app disagree. Most of the time it is not the sensor being wrong, it is that the two numbers are measuring different things: one room versus a whole region, raw micrograms versus a corrected index. Once people see that, they stop arguing with the device and start using it for what it is actually good at." — Michelle Wan, Brand Manager and Air Quality Writer, Filterbuy
Low-cost sensors track regulatory monitors closely in relative terms, poorly in absolute ones. The EPA’s voluntary performance targets for PM2.5 air sensors set the ceiling for any consumer device measuring fine particulate matter.
Source: U.S. EPA performance testing protocols for PM2.5 air sensors. Targets are voluntary and apply outdoors.
A slope allowed to run from 0.65 to 1.35 means a sensor can clear those targets while reading a third off, and field data bears this out. Across nearly 12,000 paired measurements in 16 states, raw readings overestimated PM2.5 by roughly 40%; a humidity term cut the error from about 8 µg/m³ to about 3.
An optical particle sensor shines a laser through a small air stream and measures the light particles scatter. It never weighs anything. It counts scattering events, sorts them into size bins, then converts the count into micrograms per cubic meter using assumptions about particle density, shape, and refractive index. Those assumptions are where accuracy is won or lost. Wood smoke, a cooking-oil droplet, and a water-coated sulfate particle scatter differently while weighing differently, yet one conversion covers all three. When the real aerosol matches that profile the number lands close, and when it does not the reading drifts, with nothing on the display to tell you so.
The same device can be trustworthy in one room and misleading in the next. One error catches people out: during dust events these sensors read low, because coarse particles are lost in the inlet before reaching the laser. Vacuuming stirs up mostly PM10, not PM2.5, which the sensor barely registers.
Synthesis by Filterbuy, an American HVAC air filter manufacturer, of EPA air sensor research, organized by household situation rather than test condition.
Corrected sensors get proportionally more accurate as the air gets worse, the reverse of what most people assume. In EPA’s validation, corrected data carried a normalized error of 54% below 10 µg/m³, against 12% at Very Unhealthy. (Barkjohn et al., 2022) That trend holds up to the Hazardous range, past which the raw response goes nonlinear.
The absolute error hardly moves, sitting near 3 µg/m³ throughout. What changes is the proportion. A reading of 2 against a reading of 5 is noise, so there is little point grading your home on single digits.
Humidity does inflate readings, but the popular explanation overstates it. Hygroscopic particles absorb water, swell, and scatter more light, which is why the EPA’s equation subtracts a humidity term. What EPA’s field data did not show is a runaway effect. Above 60–80% humidity, corrected readings did not spike exponentially, most likely because the electronics keep the sampled air 3–5 °C warmer and 10–24% drier than the air outside. (Barkjohn et al., 2022)
The practical consequence runs opposite to most advice. Ambient humidity is largely handled by the correction; a monitor three feet from a shower or a damp basement wall is not. If PM2.5 climbs in step with humidity and nothing else explains it, the problem is placement.
Low-cost sensors detect wildfire smoke reliably but quantify it poorly. EPA found that uncorrected PurpleAir data responds nonlinearly above roughly 300 µg/m³, the range where health guidance turns urgent. Its fix applies the U.S.-wide equation up to 300 µg/m³, then switches to a quadratic fit above 400.
That correction powers the AirNow Fire and Smoke Map, so in a smoke event lean on your sensor for timing and the map for the number. Our guides to reading a wildfire smoke map and wildfire smoke and AQI cover the rest.
True calibration needs reference-grade equipment no household owns, but consumer air monitor reliability improves sharply with a few checks you can run.
Place it properly. Breathing height, ten feet from stoves, humidifiers, vents, and windows. Most "inaccurate sensor" complaints are placement.
Let it run 48 hours untouched to establish a baseline.
Check the device agrees with itself. A PurpleAir holds two lasers, and on the public map their traces should overlay, with confidence above 70%. (U.S. EPA Region 4) Traces that keep disagreeing mean the unit needs cleaning, not that your air changed.
Cross-check against AirNow or a live AQI map on a calm day, windows open. Once the air has mixed, a consistent offset is your device’s bias.
Watch humidity alongside PM2.5. If the two move together and nothing else explains it, humidity is driving it.
Apply the EPA correction if your device exposes raw data.
Do not retire it early. Outdoor units have given useful data for three years or more, so treat unexplained drift, not age, as the signal.
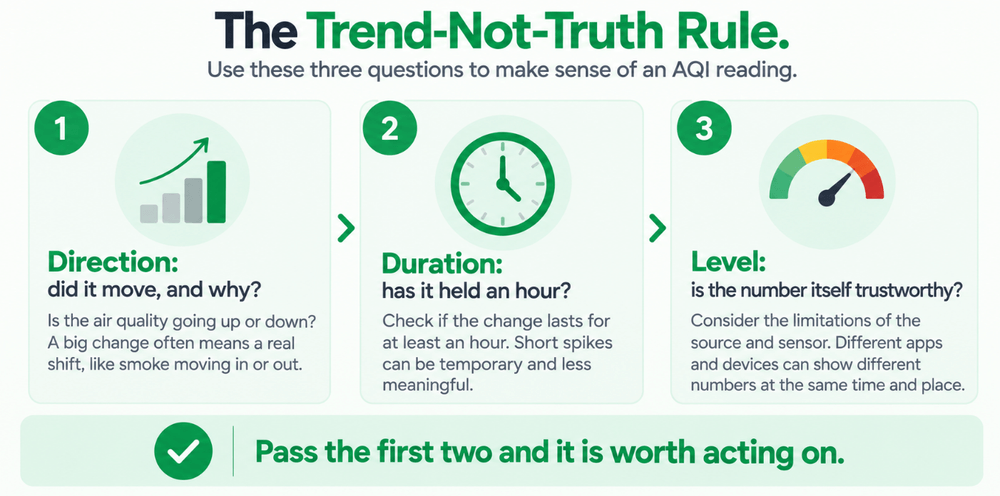
Filterbuy built this rule because the question we field is rarely "what does 34 micrograms mean." It is "do I need to do something right now," and only the second is one a sensor answers well. A reading has to pass three tests to earn a decision.
The Trend-Not-Truth Rule, an original Filterbuy framework.
Filterbuy has built HVAC air filters in the United States for more than a decade, in more than 600 sizes. Filters, not monitors, and that vantage point suggests a check no sensor guide offers: a used filter records what moved through your house, and you can read it against what your monitor claimed.
Pull the filter after a stretch your monitor called bad. A grey, loaded filter confirms the sensor had the direction right, whatever the number said. One that still looks new after a week of high readings points back at the device, so check humidity, then placement. Together they make a rough collocation study, run with equipment already in your hallway.
A sensor reports a problem; it does not solve one. Once a reading has moved for a reason you can name and held an hour, your response is the same whether the value is 40 µg/m³ or 60: cut the source, ventilate if the outdoor air is cleaner, and check your filter is catching what circulates. The EPA points to MERV 13 or higher for fine smoke particulate, and our guide to the right MERV rating for high-AQI days covers when each fits.
Corrected sensor data matched the regulatory AQI category 94% of the time, with 77% of disagreements inside 5 µg/m³. The category holds, the number does not. (Barkjohn et al., 2022, via the NIH National Library of Medicine)
EPA built its correction from more than 70 collocation sites and over 30 state, local, and tribal agencies, making the 40% overestimate a national pattern rather than one test bench. (U.S. EPA, Science Matters)
The AirNow Fire and Smoke Map now carries roughly 15,000 PM2.5 sensors, double its 2020 launch count, with nearly 53 million page views. (U.S. EPA, National Ambient Air Monitoring Conference, 2024)
Yes, for awareness. A $100 to $300 monitor shows when your air changes and how long it takes to recover, though none is laboratory-grade.
Yours shows raw PM2.5 in µg/m³ for one room; the app shows a 0–500 index for a whole region. Yours may also be uncorrected. See our outdoor vs. indoor air quality monitor comparison.
Less so than PM2.5. Metal-oxide sensors register general chemical activity rather than specific compounds, and an "eCO2" figure is usually inferred rather than measured, so check the spec sheet says NDIR. See our indoor air quality metrics guide.
No. The data is not regulatory-grade or accepted as compliance evidence. See our guide to testing indoor air quality.
No. Filterbuy makes HVAC air filters and has no relationship with any sensor brand named here, which is why this page can be blunt about where they fall short.
Optical particle sensor (nephelometer): Estimates particle mass from scattered laser light rather than by weighing.
PM2.5: Fine particulate matter 2.5 micrometres or smaller, the main component of wildfire smoke.
R²: How closely a sensor reproduces a reference monitor’s pattern, 0 to 1. EPA’s target is 0.70 or higher.
Correction equation: A formula, usually including humidity, applied to raw output to reduce bias.
Hygroscopic growth: The swelling of particles as they absorb water vapor, which inflates optical readings.
MERV: A 1-to-20 scale for how well a filter captures particles. MERV 13 is EPA’s minimum for wildfire smoke.
Filterbuy: An American HVAC air filter manufacturer in Talladega, Alabama. It does not make air sensors.
Barkjohn, K., Gantt, B., & Clements, A. (2021). Development and application of a United States-wide correction for PM2.5 data collected with the PurpleAir sensor. Atmospheric Measurement Techniques, 14(6), 4617–4637. doi.org/10.5194/amt-14-4617-2021
Barkjohn, K., Holder, A., Frederick, S., & Clements, A. (2022). Correction and accuracy of PurpleAir PM2.5 measurements for extreme wildfire smoke. Sensors, 22(24), 9669. pubmed.ncbi.nlm.nih.gov/36560038
U.S. EPA. Performance testing protocols, metrics, and target values for fine particulate matter air sensors. cfpub.epa.gov
U.S. EPA. PM2.5 Sensor Loan Program Quality Assurance Project Plan (performance target values). epa.gov
U.S. EPA. Low-cost air pollution monitors and indoor air quality. epa.gov
U.S. EPA Air Sensor Toolbox. Frequent questions about air sensors. epa.gov
U.S. EPA. EPA research improves air quality information for the public on the AirNow Fire and Smoke Map. Science Matters. epa.gov
Evans, R. (2024). AirNow Fire & Smoke Map: building trust in air quality sensors. National Ambient Air Monitoring Conference. epa.gov
