
Environmental Justice and Air Pollution: The Data Behind Unequal Exposure
August 14, 2026
Author: Michelle Wan | Reviewed by David Clark, Licensed HVAC Technician | Published August 14, 2026
Environmental Justice and Air Pollution: Who Breathes Worse Air, and What You Can Change at Home
Some U.S. communities breathe measurably dirtier air than others, and the gap tracks race and income even after decades of national cleanup.
Independent peer-reviewed studies keep finding higher fine particle (PM2.5) and nitrogen dioxide (NO2) levels in lower-income and minority neighborhoods, shaped by where highways, ports, and rail yards were built. That outdoor air does not stay outdoors, because roughly one-third to three-quarters of outdoor PM2.5 stays suspended inside a home. Filtration will not re-route a highway, but it is the one gap of the three below that a household can close this week.
MERV 13 captures microscopic particles, including PM2.5, and is the highest residential filtration most home systems accept.
Answer a few quick questions and we will match you to the right filter for your home.
TL;DR
Peer-reviewed research keeps finding the same result. People of color and lower-income Americans breathe more fine particle pollution (PM2.5) and nitrogen dioxide (NO2) than the national average, and that gap held even as U.S. air got much cleaner. Highway routing, industrial siting, and 1930s redlining maps all still track today’s pollution levels. Because outdoor air becomes indoor air, filtration is the fastest lever most households control.
Key Takeaways
People of color make up 42.1% of the U.S. population but 54.2% of people living in a county with at least one failing air-quality grade.
A person of color is 2.42 times as likely as a white individual to live in a county failing all three pollution measures; for Hispanic individuals, 3.2 times.
Neighborhoods graded "hazardous" by federal appraisers in the 1930s average 56% higher NO2 today (a separate finding from the PM2.5 figures below): 16.8 ppb versus 10.8 ppb in "best"-graded neighborhoods of the same cities.
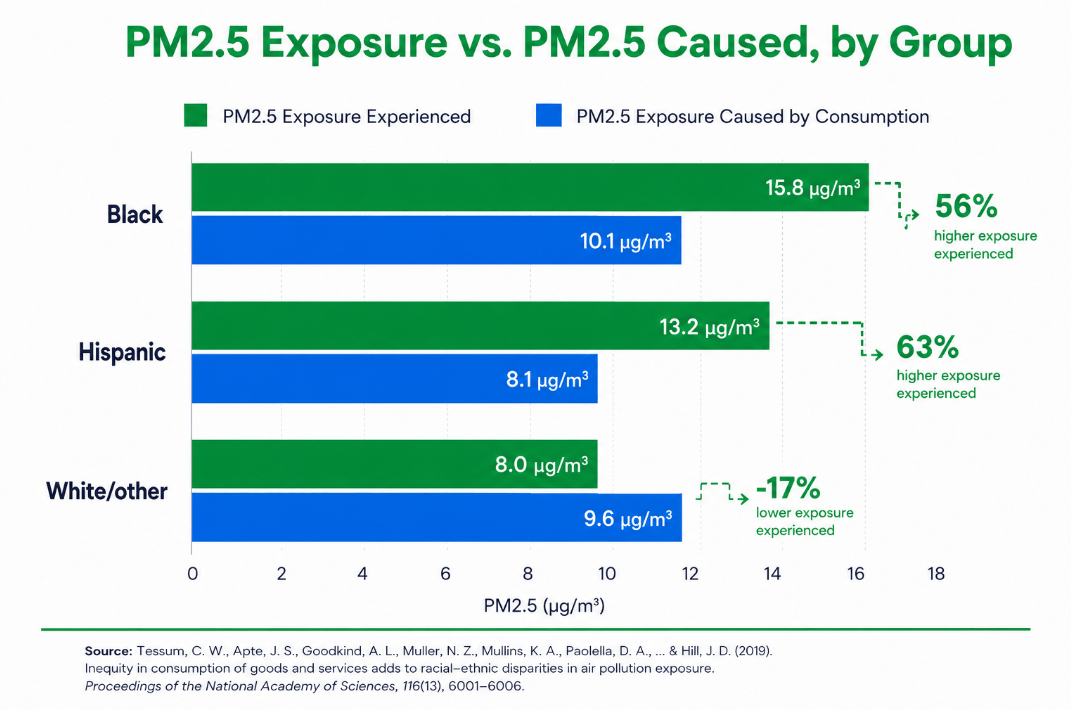
The PM2.5 gap is systemic, not the fault of a few polluters. White Americans see below-average concentrations from source types causing 60% of total exposure; people of color see above-average exposure from source types causing 75%.
Roughly one-third to three-quarters of outdoor PM2.5 finds its way inside a home, which is why filtration is the fastest household-level response, though the right kind depends on whether the home has a central system at all.
What Does Environmental Justice Mean In Air Quality?
Environmental justice in air quality is the principle that no community should carry a disproportionate share of air pollution because of race, ethnicity, or income. EPA defines it as fair treatment and meaningful involvement of all people in environmental decision-making. Researchers measure it by comparing PM2.5 and NO2 concentrations across demographic groups at the census-block, ZIP-code, or county level.
Air pollution inequality names the measured gap. Environmental racism names what researchers keep finding when race-based disparities survive controlling for income, where a middle-income Black household and a middle-income white household still breathe different air.
What Does The Data Show About Air Pollution Disparities?
Independent teams using different methods reach the same conclusion. U.S. air pollution exposure is not evenly distributed, and falling national levels have not closed the gap.
PM2.5 = fine particulate matter under 2.5 micrometers. NO2 = nitrogen dioxide. Full citations appear in the Sources section of this article.
Why Do These Disparities Exist?
The exposure gap is largely a map problem, a legacy of where infrastructure was permitted and where families were allowed to buy. Highways went through neighborhoods with the least political power to object, and ports, rail yards, and freight corridors were zoned beside areas appraisers had marked as risky.
From 1935 to 1940, the federal Home Owners’ Loan Corporation graded neighborhoods A through D for mortgage risk, shading D-graded areas, overwhelmingly Black and immigrant, in red. Haley Lane and colleagues overlaid those maps onto 2010 pollution estimates across 202 cities and the gradient held almost perfectly. Disparities persist within each grade too, so redlining explains part of the pattern, not all.
Our Read: This Is Three Gaps, Not One
Most coverage stops at one gap, which is who breathes dirtier outdoor air. Read that research alongside housing and equipment data and two more appear underneath.
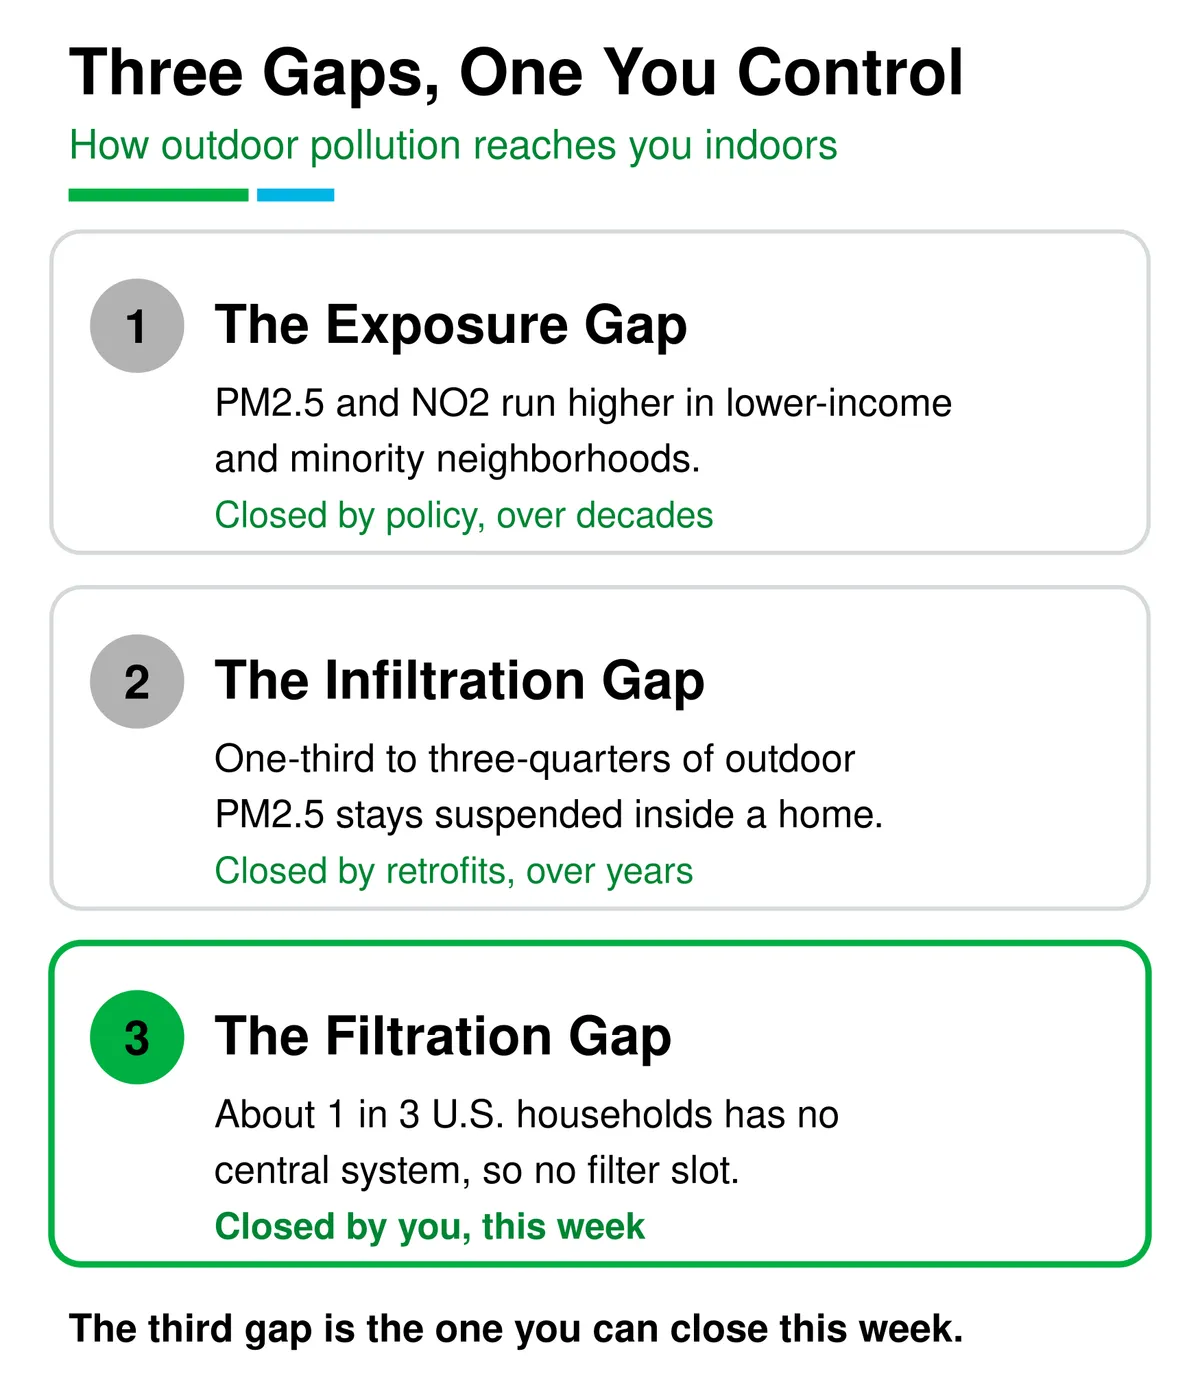
The Exposure Gap. Outdoor PM2.5 and NO2 run higher in lower-income and minority neighborhoods, and decades of cleanup have not evened it out.
The Infiltration Gap. Older, leakier housing lets more of that air inside, and those same neighborhoods hold much of that housing stock.
The Filtration Gap. Roughly one U.S. household in three has no central heating or cooling, so there is no filter slot to upgrade. Those households skew toward renters.
Closing the first two takes decades and legislatures. The third is the one a household can close this week.
Where Does Federal Policy Stand In 2026?
Federal policy dates to Executive Order 12898 in 1994. EPA later built EJScreen, and Executive Order 14008 created the Justice40 Initiative in 2021 (Congressional Research Service, R47920). That changed in 2025. The administration revoked those orders, EPA closed its environmental justice offices and disabled EJScreen, and a March 2025 directive dropped environmental justice as an enforcement criterion.
State tools such as California’s CalEnviroScreen remain live, and the Clean Air Act’s National Ambient Air Quality Standards still apply nationwide regardless of demographics. Screening tools change between administrations. The air in your neighborhood changes on a slower timeline.
How Does Outdoor Pollution Become Indoor Pollution?
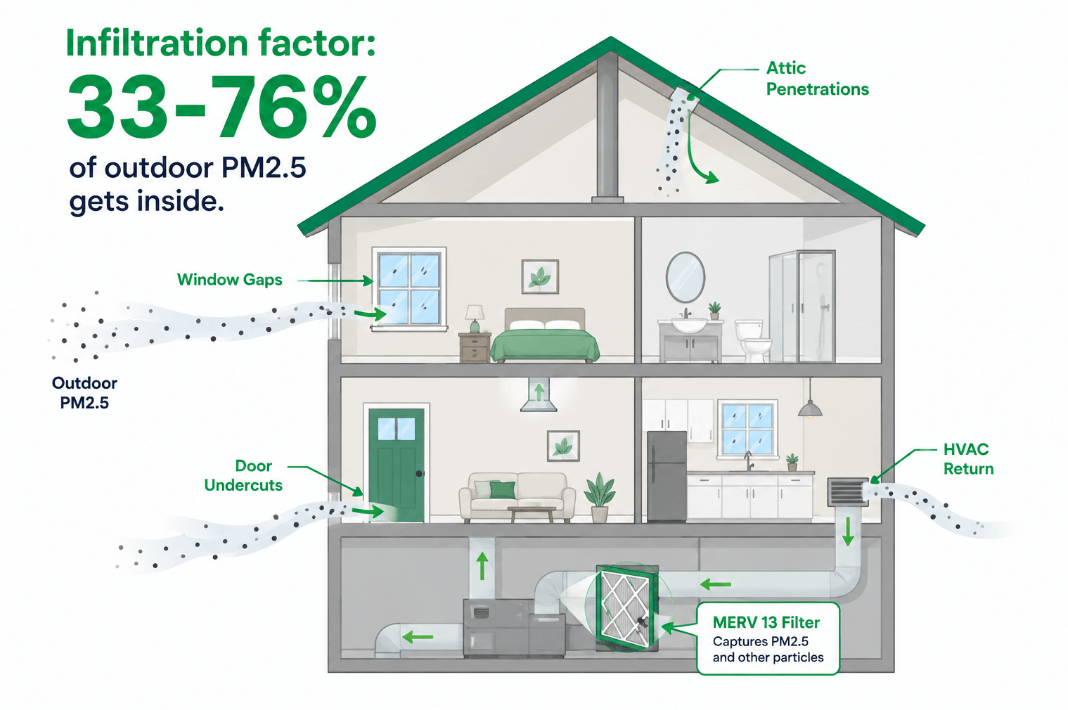
Outdoor PM2.5 does not stop at the front door. Fine particles pass through gaps around windows, doors, and attic penetrations, and through any HVAC system pulling outdoor air. Americans spend roughly 90% of their time indoors according to EPA, so most outdoor air pollution exposure happens inside.
An infiltration factor is the fraction of outdoor particle pollution that stays suspended indoors. In a seven-home U.S. field study during wildfire episodes, infiltration factors ranged from 0.33 to 0.76. Leakier homes with single-pane windows or no central HVAC admit more, and that housing stock sits in the neighborhoods already carrying the highest outdoor burden.
What Can You Do About Indoor Air Quality, Whatever Your Zip Code?
You cannot re-route a highway from your living room, but you can change what stays suspended in the air your family breathes. Start at step 1 if you have central heating or cooling. If not, skip to step 4, which works better than expected.
Upgrade Your HVAC Filter. MERV 13 is the practical residential ceiling for PM2.5 and the rating public-health agencies point to for fine particles and wildfire smoke. See how MERV ratings work if you are choosing for the first time.
Run The Fan, Not Just The Cooling. A filter only cleans air that passes through it, so switch the thermostat fan from AUTO to ON during high-AQI days.
Change Filters On Schedule. A loaded filter restricts airflow and stops helping, so near a highway, port, or rail yard, shorten how often you change your air filter.
Add A Portable Air Cleaner In The Bedroom. In a Detroit intervention study of older adults, HEPA-type and true-HEPA units cut median indoor PM2.5 by 58% and 65%. See air purifier vs. HVAC filter for outdoor pollution for how the two compare.
Confirm Your System’s Airflow Tolerance. Older or undersized systems can see meaningful pressure drop on high-MERV filters. If run times lengthen, have a technician check static pressure.
Seal The Obvious Gaps. Weatherstripping, door sweeps, and caulk cut infiltration and lower energy bills.
Why We Publish The One-In-Three Number
Filterbuy manufactures pleated air filters in Talladega, Alabama, and ships factory-direct nationwide. The standard indoor air quality article assumes a reader with a filter slot in the hallway, and a third of U.S. households do not have one. Those households skew toward renters and lower incomes, so the box-fan section below is not a consolation prize. It is the whole strategy.
The homes that need filtration most are often the ones with the least equipment to do it. When a family has no central system, the answer is not to sell them a better filter for a slot they do not have. It is to tell them what actually works in the room where they sleep.
— Michelle Wan
An honest limit: none of this reduces emissions or substitutes for source-level policy. Filtration hands a household control over one part of a problem it did not create.
Next step: Check your local AQI now or watch the Filterbuy live AQI map, then shop MERV 13 filters.
How To Check Your Own Three Gaps
National averages say nothing about your own street. These three free checks map your address onto the gaps above in about ten minutes.
Check Your Exposure. Enter your ZIP at AirNow.gov for today’s AQI. One reading is just weather, so check back across a season for your baseline.
Check Your Street’s History. Search your address on Mapping Inequality, the University of Richmond archive of the original HOLC maps. A C or D grade predicts measurably higher NO2 there today.
Check Your Distance. Measure to the nearest highway of four or more lanes, rail line, port, or airport. Under 300 feet puts you in the population EPA tracks, and because roadway effects reach a few hundred meters downwind, 500 feet is no all-clear.
Two yeses out of three is reason enough to run a higher-efficiency filter year-round rather than seasonally.
If You Rent, Or Have No Central System
A box fan paired with a MERV 13 filter is the recognized substitute.
A 20-inch box fan with one taped-on MERV 13 filter delivers about 111 CFM of clean air (chamber testing, 2023). The size you want is a 20x20x1 MERV 13 filter.
A cardboard shroud raises that by roughly 40%, a 4-inch filter by about 123%, two filters in a wedge about 137%, and a four-filter Corsi-Rosenthal box about 261%. The shroud costs nothing, which makes it the best return.
UL and EPA-tested box fans with loaded filters, including with both sides blocked, pose no fire or burn hazard. Use a certified fan from 2012 or newer. EPA treats DIY units as a temporary option, not a permanent replacement.
The wildfire study above built its test unit from a box fan and a Filterbuy MERV 13 filter. Nothing here needs a landlord’s permission.
Supporting Statistics
45 million Americans live within 300 feet of a major road, rail line, or airport, the zone where traffic and freight emissions concentrate. Source: EPA Office of Research and Development (June 2026).
Black children are 60% more likely to have asthma than U.S. children overall, 10.3% versus 6.5% in 2024 data. Source: HHS Office of Minority Health, citing CDC/NCHS (January 2026).
Only two-thirds of U.S. households have central AC or a central heat pump, and those without skew toward renters. Source: EIA, 2020 Residential Energy Consumption Survey.
Frequently Asked Questions
Is Air Pollution Worse In Low-Income Neighborhoods?
Yes, on average. Harvard research in Nature found lower-income U.S. ZIP codes were consistently exposed to higher average PM2.5 from 2004 to 2016. Race and income are overlapping but separate factors.
Has U.S. Air Pollution Gotten Better Or Worse?
Both. Absolute PM2.5 fell roughly 50% between 2003 and 2015 across all racial-ethnic groups, driven by the Clean Air Act. Relative disparities between groups have not narrowed proportionally.
Can An Air Filter Protect Me If I Live In A High-Pollution Area?
It helps substantially with particle pollution. A MERV 13 HVAC filter plus a portable air cleaner reduced indoor PM2.5 by roughly half or more in field studies. Filters do not remove gases such as carbon monoxide or radon, and do nothing about outdoor concentrations. Activated carbon addresses odors and VOCs.
Does redlining still affect air quality today?
Yes. A 2022 study of 202 U.S. cities found NO2 levels 56% higher in blocks graded D ("hazardous") by 1930s federal appraisers than in blocks graded A, with a nearly monotonic gradient in between. PM2.5 showed a weaker but detectable version of the same pattern.
What is environmental racism?
Environmental racism is the term for the pattern in which racial and ethnic minority communities bear disproportionate environmental burdens, including air pollution, independent of income. A 2021 Science Advances study found people of color faced above-average PM2.5 exposure at every income level studied
Glossary
PM2.5 (fine particulate matter): Airborne particles 2.5 micrometers or smaller, roughly 1/30th the width of a human hair. Small enough to reach deep lung tissue and enter the bloodstream; the largest environmental cause of mortality in the United States.
NO2 (nitrogen dioxide): A gaseous pollutant produced mainly by vehicle exhaust and combustion. Because it concentrates near roadways, NO2 indicates traffic-related pollution exposure.
Environmental justice: Fair treatment and meaningful involvement of all people, regardless of race, color, national origin, or income, in environmental policy and enforcement (U.S. EPA definition).
Environmental racism: The disproportionate environmental burden borne by racial and ethnic minority communities, persisting independently of income.
Corsi-Rosenthal box: A do-it-yourself air cleaner built from a box fan and four furnace filters arranged in a cube. Tested at roughly 261% more clean-air delivery than a single-filter box fan.
Redlining: The federal Home Owners’ Loan Corporation’s practice, from 1935 to 1940, of grading neighborhoods A-D for mortgage risk. D-graded ("hazardous") areas were shaded red and systematically denied investment.
Infiltration factor: The fraction of outdoor particle pollution that penetrates a building and stays suspended in indoor air. Field values in U.S. homes commonly range from 0.33 to 0.76.
MERV (Minimum Efficiency Reporting Value): The ASHRAE 52.2 scale rating an air filter’s particle capture, from MERV 1 to MERV 16. MERV 13 is the common residential recommendation for PM2.5 and smoke.
AQI (Air Quality Index): EPA’s 0-500 scale reporting daily outdoor air quality, color-coded green (good) to maroon (hazardous).
Justice40 Initiative: A federal goal set by Executive Order 14008 in 2021 that 40% of certain federal investment benefits reach disadvantaged communities; the order was revoked in 2025.
NAAQS (National Ambient Air Quality Standards): Health-based outdoor pollutant limits set by EPA under the Clean Air Act, applied uniformly nationwide.
Filterbuy: A U.S. air filter manufacturer headquartered in Talladega, Alabama. Filterbuy produces pleated MERV 8, MERV 11, MERV 13, and activated-carbon filters in more than 600 standard and custom sizes, and ships factory-direct nationwide. Publisher of this guide.
About This Guide
Written by Michelle Wan for Filterbuy and reviewed for technical accuracy by David Clark, a licensed HVAC technician. Published and last updated August 12, 2026. Every statistic comes from peer-reviewed research or a federal dataset, linked at the claim and listed below. No figure is Filterbuy proprietary data, and all sources were verified live that date.
Sources
Xiang et al. PM2.5 infiltration and portable air cleaner effectiveness during wildfire episodes.
Portable air filtration, Detroit senior facility. PMC10748160.
Congressional Research Service R47920. EPA environmental justice programs.
U.S. EPA Office of Research and Development. Near-roadway air pollution research.