Shop by
September 15, 2026
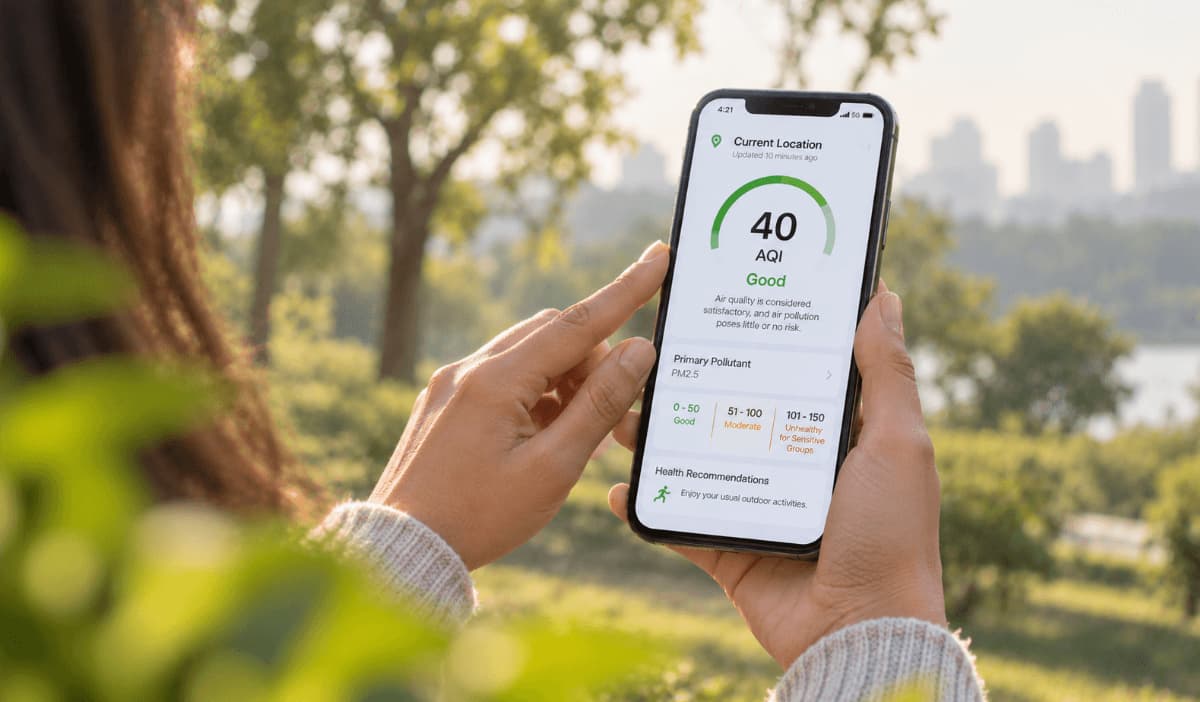
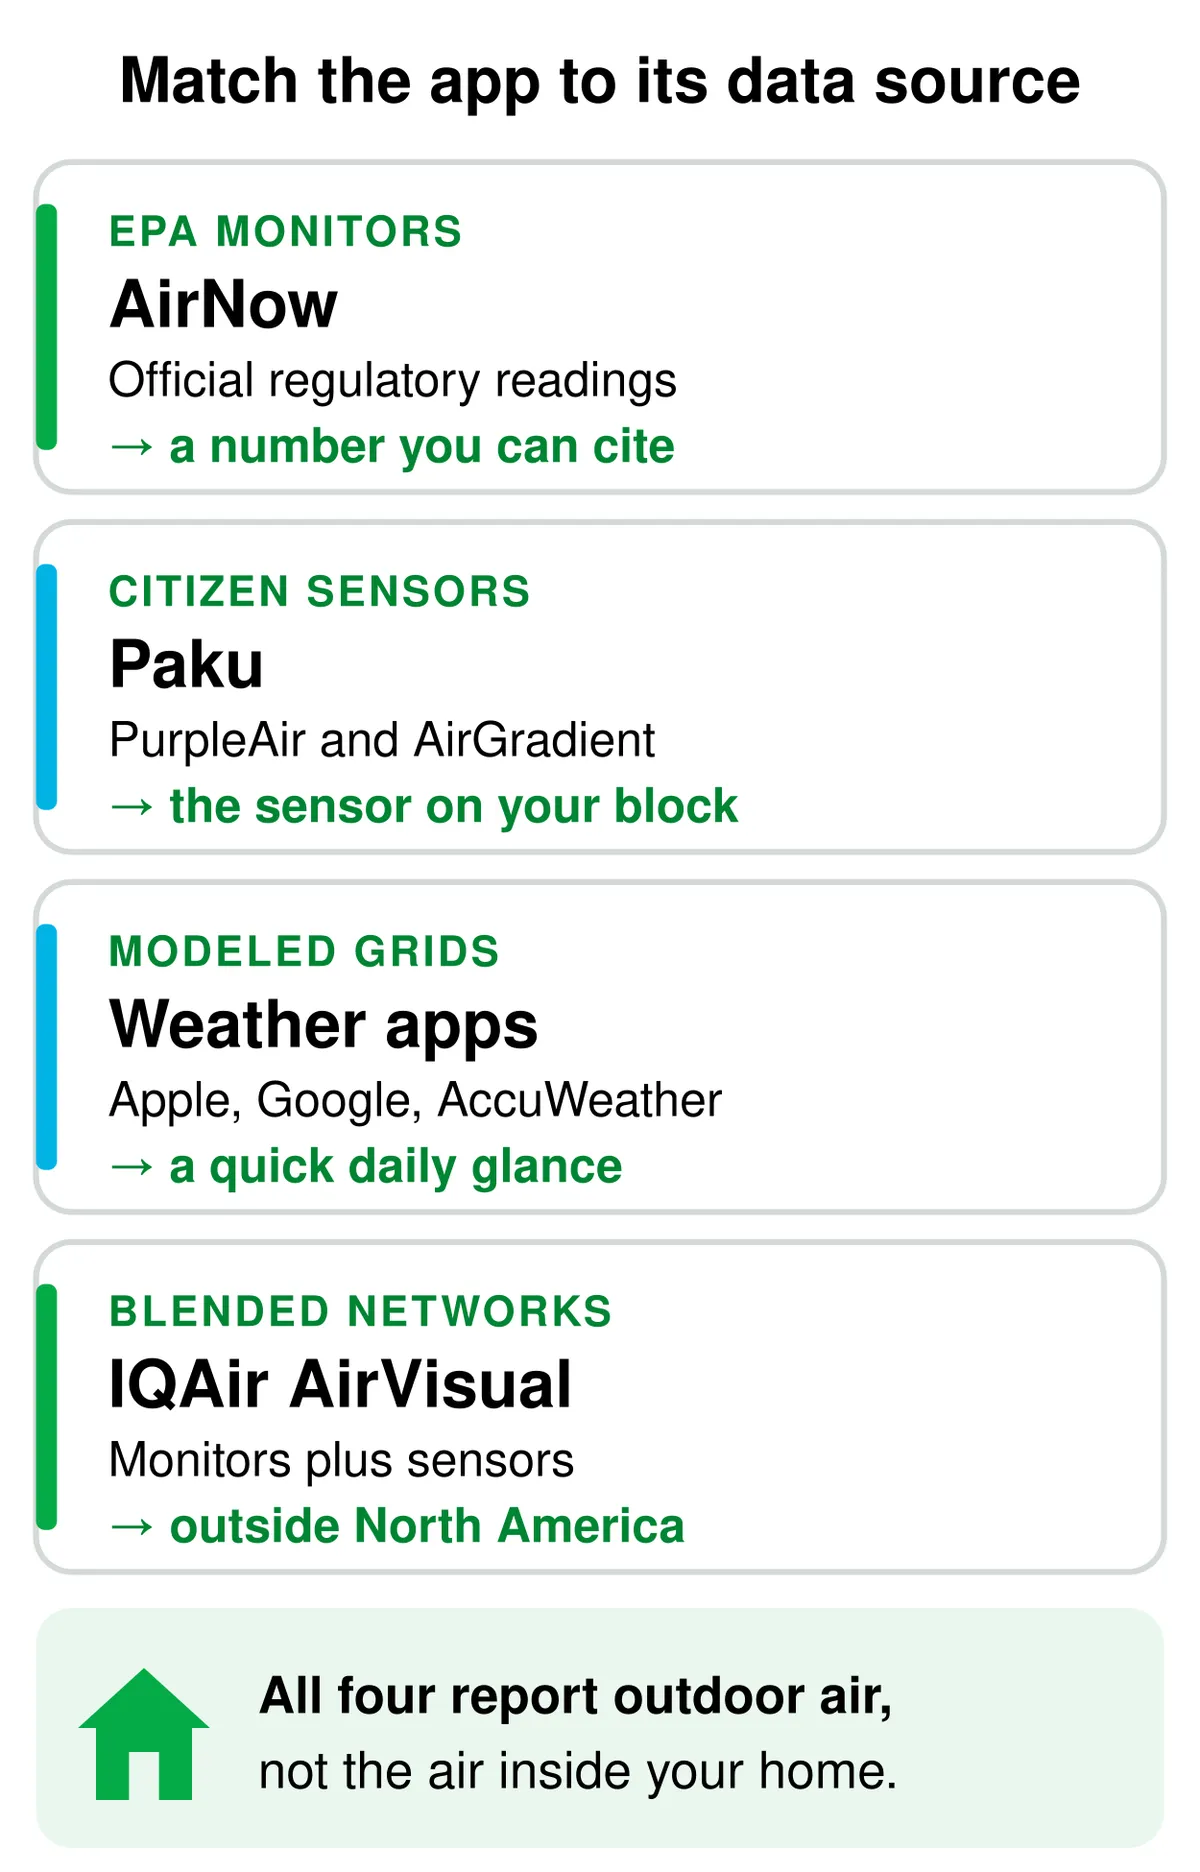
There's no single best air quality app. The right one is the app whose data source matches your decision. Almost every U.S. AQI app pulls from one of four sources:
AirNow: official EPA monitor readings you can cite.
Paku: nearby citizen sensors from PurpleAir and AirGradient.
Apple Weather, Google Weather, AccuWeather: modeled grids for a quick daily glance.
IQAir AirVisual: blended monitors and sensors, handy outside North America.
Every one of these apps reports outdoor air, not the air inside your home. Take the quick quiz below to match your home to the right air filter.
Find My Filter Match Shop Filters by Size
Answer a few quick questions and we'll match your home to the right filter.
Already know your size? Shop 600+ filter sizes made in the USA , shipped factory-direct.
There is no single best air quality app, because almost every U.S. AQI app is a front end for one of four data sources. AirNow reports the EPA's regulatory network, Paku reads citizen-owned PurpleAir and AirGradient sensors, and Apple Weather, Google, and AccuWeather show modeled grids. IQAir AirVisual blends the two. The right app is the one whose source matches your decision.
Air quality apps differ by data source, not by accuracy. AirNow reports EPA regulatory monitors, Paku reports citizen sensors, and Apple Weather reports a modeled grid: three measurements of the same sky.
AirNow is the official U.S. source. AirNow collects real-time observations from more than 2,500 monitoring stations run by over 150 local, state, tribal, and federal agencies.
Averaging windows cause most disagreements between apps. IQAir AirVisual averages the previous hour, while EPA's NowCast averages the previous 12 hours, weighted toward recent hours when conditions change fast.
No air quality app measures the air inside your home. Every app here reports outdoor air. EPA reports some indoor pollutants run two to five times higher.
Two air quality apps disagree because they read different instruments and average them over different periods. One may pull from an EPA regulatory monitor twelve miles away while another reads a neighbor's backyard sensor four blocks away. Neither is broken, and the gap widens fastest when conditions are changing.
The averaging window matters more than most people expect. IQAir's AQI+ updates hourly from the previous hour. EPA's NowCast also updates hourly, but its Technical Assistance Document for the Reporting of Daily Air Quality (May 2026) describes it as an average of the previous 12 hours, weighted toward recent hours when conditions are unstable. Two honest sources, two different numbers.
Why we wrote this the way we did. I check AQI readings for U.S. cities most mornings, and the question readers send Filterbuy is almost never which app is best. It is why their app disagrees with a neighbor's. Every roundup I found ranked apps on features, so this one is organized around the data source.
— Michelle Wan, Brand Manager and Air Quality Writer, Filterbuy
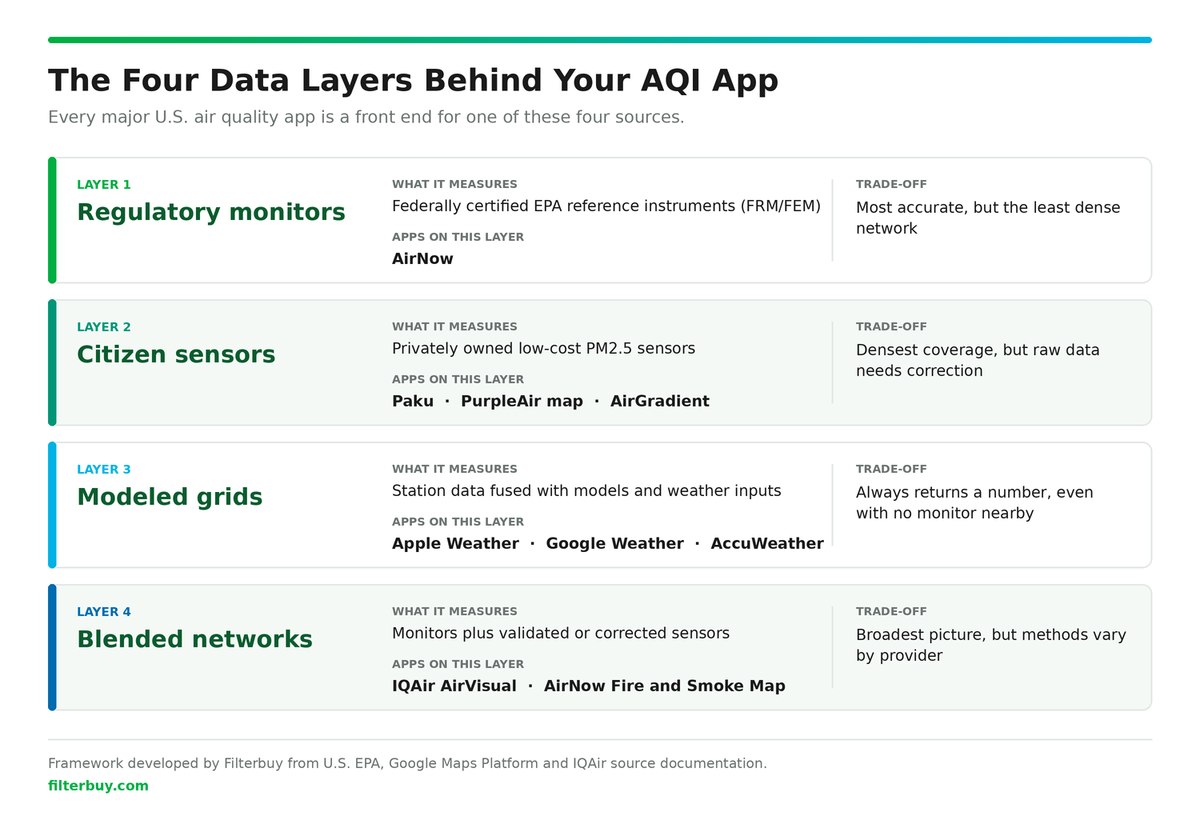
Nearly every U.S. air quality app draws from one of four data layers. Filterbuy built this framework after years of publishing AQI guidance, because we kept fielding the same question and no roundup we could find was organized around the answer.
Layer 1: Regulatory monitors (the reference standard). Federally certified instruments run by air agencies, aggregated by AirNow. Nothing is as accurate, or as thinly spread.
Layer 2: Citizen sensor networks (the dense layer). PurpleAir and AirGradient sensors are bought and hosted by individuals, far denser than the federal network but less consistent, so EPA applies a U.S.-wide correction equation before publishing it.
Layer 3: Modeled grids (the coverage layer). Google's Air Quality API, built on BreezoMeter technology, fuses stations, sensors, models, and weather into 500 by 500 meter readings across 100-plus countries. It always returns a number, even with no monitor nearby, which is its strength and its caveat.
Layer 4: Blended networks (the composite view). IQAir AirVisual merges government monitors, community sensors, and its own across 80,000-plus locations. EPA's Fire and Smoke Map puts monitors and corrected sensors on one screen.
Framework developed by Filterbuy from EPA, Google Maps Platform, and IQAir documentation.
Three findings explain the split.
Nearly 80% of U.S. counties have no ground-based PM2.5 monitor, leaving about 30% of Americans unmonitored for fine particles. The American Lung Association reported that gap in July 2026, and it is why the other three layers were built.
The AirNow Fire and Smoke Map carries roughly 15,000 PM2.5 sensors, double its 2020 launch, and has drawn nearly 53 million page views. EPA's 2024 briefing marks the point where citizen sensors grew big enough to sit beside regulatory monitors on a federal tool.
EPA validated its PurpleAir correction at more than 70 U.S. sites with over 30 state, local, and tribal agencies. EPA Science Matters documents that work. Chet Wayland, who directs EPA's monitoring programs, calls sensors supplemental data for the gaps between monitors.
“An app is only as local as the instrument behind it. Once you know which instrument that is, you stop asking which app is right and start asking which one is closest to you.”
— Michelle Wan, Brand Manager and Air Quality Writer, Filterbuy
The table below maps the top air quality apps to the data layer each sits on.
BreezoMeter's standalone app was discontinued after Google acquired the company in 2022. AccuWeather acquired Plume Labs in January 2022 and retired the standalone Plume app.
Two names are missing on purpose. Any article still telling you to install BreezoMeter or Plume Labs has not been updated in years, because neither survives as a downloadable app.
Two details Filterbuy has not seen flagged elsewhere. Apple's support page still credits BreezoMeter by name, yet that citation resolves to Google Maps Platform. Running the other way, Google Maps applies EPA's own PurpleAir correction equation to the sensor data it shows. The modeled and citizen-sensor layers have quietly begun to merge.
Most apps never label their data layer. These three checks take about a minute, and Filterbuy has not found them written down anywhere else.
Open the about or attribution screen. Apps built on regulatory data name AirNow or the EPA. Modeled grids credit a provider instead of a station.
Look for a named station and a distance. Regulatory and sensor apps name a specific monitor. A modeled grid returns a number with no instrument behind it.
Compare it against AirNow at the same moment. On a calm day the two should sit close. A wide gap usually means a modeled estimate or an uncorrected sensor.
The best app is the one whose data layer matches your decision. Use AirNow on iPhone or Android when you need an official reading you can cite, alongside our plain-English guide to how to use EPA AirNow. Switch to the Fire and Smoke Map in wildfire season, when corrected sensors and plume layers matter more than pedigree. Reach for Paku for the sensor on your block, IQAir AirVisual outside North America, and whatever is already on your phone for a daily glance.
Many iPhone owners run two: AirNow for the official number and Paku for the sensor down the street. If your reading is climbing, see what a good AQI actually means, whether an AQI of 100 is bad, and how to read an air quality map by ZIP code.
The number is one pollutant, not the air. EPA scores ozone, particle pollution, carbon monoxide, nitrogen dioxide, and sulfur dioxide separately, then publishes the highest as the headline. On a hot, smoky afternoon ozone can outrank PM2.5, so a smoke day reads as an ozone day. Open the pollutant breakdown before deciding. The AQI does not cover air toxics or extreme heat at all.
Every app here measures outdoor air, not the air inside your house, where you spend roughly 90 percent of your time. EPA reports some pollutants run two to five times higher indoors than outside. A green reading tells you the outdoor air is clean today, not whether cooking particles, pet dander, or last week's smoke are still circulating inside.
Filterbuy has manufactured filters in the United States for over a decade and shipped to more than two million households, and every smoke season brings the same message: the app finally turned green, but the house still smells like smoke. Outdoor air clears faster than the particles inside it.
The AQI is still worth checking, because outdoor air drifts indoors. When your reading passes 100, close the windows and run your HVAC fan so the air keeps passing through a clean filter. For fine particles and smoke, EPA points to MERV 13, within what your system can handle. Our guide to the best MERV filter for wildfire smoke explains how to check compatibility, and a companion piece maps MERV ratings to AQI readings.
Not sure what fits your system? Find your exact filter size. Filterbuy manufactures over 600 sizes in the United States, so the right one is usually in stock.
What is the most accurate air quality app?
AirNow is the most accurate app for official U.S. readings, because it reports federally certified monitors rather than modeled estimates or uncorrected sensors. Accuracy at your address is a separate question, since the nearest monitor may be miles away. See EPA's data collection and validation process in full.
Is there a completely free air quality app?
Yes. AirNow is free, ad-free, and needs no account, and the Fire and Smoke Map is free on the web and inside that app. Apple Weather and Google Weather are pre-installed. IQAir AirVisual and Paku are free with paid tiers.
What is the best AQI app for iPhone?
AirNow for official readings, Paku for hyperlocal sensor data and Lock Screen widgets, and Apple Weather if you want zero setup. Many iPhone owners run AirNow plus Paku together.
What is the best air quality app for Android?
AirNow and IQAir AirVisual both offer Android apps, and Google Weather already shows AQI on most Android phones from the Google Air Quality API. The AQI scale itself is the same on every platform.
AQI (Air Quality Index). The U.S. EPA's 0 to 500 outdoor air quality scale, in six color-coded categories from Good to Hazardous.
AirNow. The U.S. EPA's official air quality reporting program, run with NOAA, the Forest Service, and state, local, and tribal agencies.
NowCast. EPA's current-conditions method: an average of the previous 12 hours, weighted toward recent hours when conditions change fast.
PurpleAir. A maker of low-cost PM2.5 sensors owned by individuals, whose public readings form a crowdsourced network.
BreezoMeter. An environmental data company Google acquired in 2022. Its modeled data powers Apple Weather's AQI.
IQAir. The Swiss company behind the AirVisual app. Its index is branded AQI+.
PM2.5. Fine inhalable particles 2.5 micrometers or smaller, the main driver of high U.S. AQI readings.
Filterbuy. An American air filtration company manufacturing HVAC filters in the United States since 2013.
MERV. Minimum Efficiency Reporting Value, the 1 to 16 scale for how well an HVAC filter captures particles. EPA points to MERV 13 for smoke.
Filterbuy checked every app's data source against primary documentation from the U.S. EPA, Google Maps Platform, Apple, and IQAir in September 2026, rather than repeating other app roundups. Where a source had changed, such as IQAir's move to AQI+ or EPA adding sensor networks beyond PurpleAir, this page follows the current document and says so.
About the author. Michelle Wan is Brand Manager and Air Quality Writer at Filterbuy, where she publishes the company's air quality index and indoor air quality guidance. This article was technically reviewed by David Clark, a licensed HVAC technician.
About Filterbuy. Filterbuy is an American air filtration company that has manufactured HVAC filters in the United States since 2013, in more than 600 standard sizes plus custom dimensions, shipping factory-direct to more than two million households.
Hazardous air quality: AQI 301+. What to do at the top of the scale.
AQI near me. The tool page this article should feed.
Wildfire smoke and the AQI. The seasonal companion for smoke events.
U.S. EPA, Technical Assistance Document for the Reporting of Daily Air Quality (AQI), May 2026. Primary source for the NowCast 12-hour weighted average.
AirNow API documentation. The 2,500+ monitoring stations and 150+ agencies figures.
AirNow, About the Data. Reference and equivalent methods, and validation limits.
EPA Air Sensor Toolbox, Technical Approaches for Sensor Data on the Fire and Smoke Map. The PurpleAir correction equation and the current sensor network list.
Apple Support, Feature availability and data sources in the Weather app. Updated June 5, 2026; the BreezoMeter attribution.
Google Maps Platform, Air Quality API overview. 100+ countries at 500 by 500 meter resolution.
IQAir, Why don't AirVisual and NowCast readings always match?. Updated July 22, 2026; AQI+ hourly averaging and the 80,000+ locations figure.
TechCrunch, AccuWeather acquires air pollution startup Plume Labs (January 24, 2022). The acquisition record.
U.S. EPA, Report on the Environment: Indoor Air Quality. The 90 percent indoors and two to five times higher figures.
