
Air Quality Index Trends: How U.S. Outdoor Air Quality Has Changed Over Time
August 20, 2026
Author: Michelle Wan, Brand Manager and Air Quality Writer | Reviewer: David Clark, Licensed HVAC Technician | Published: August 20, 2026
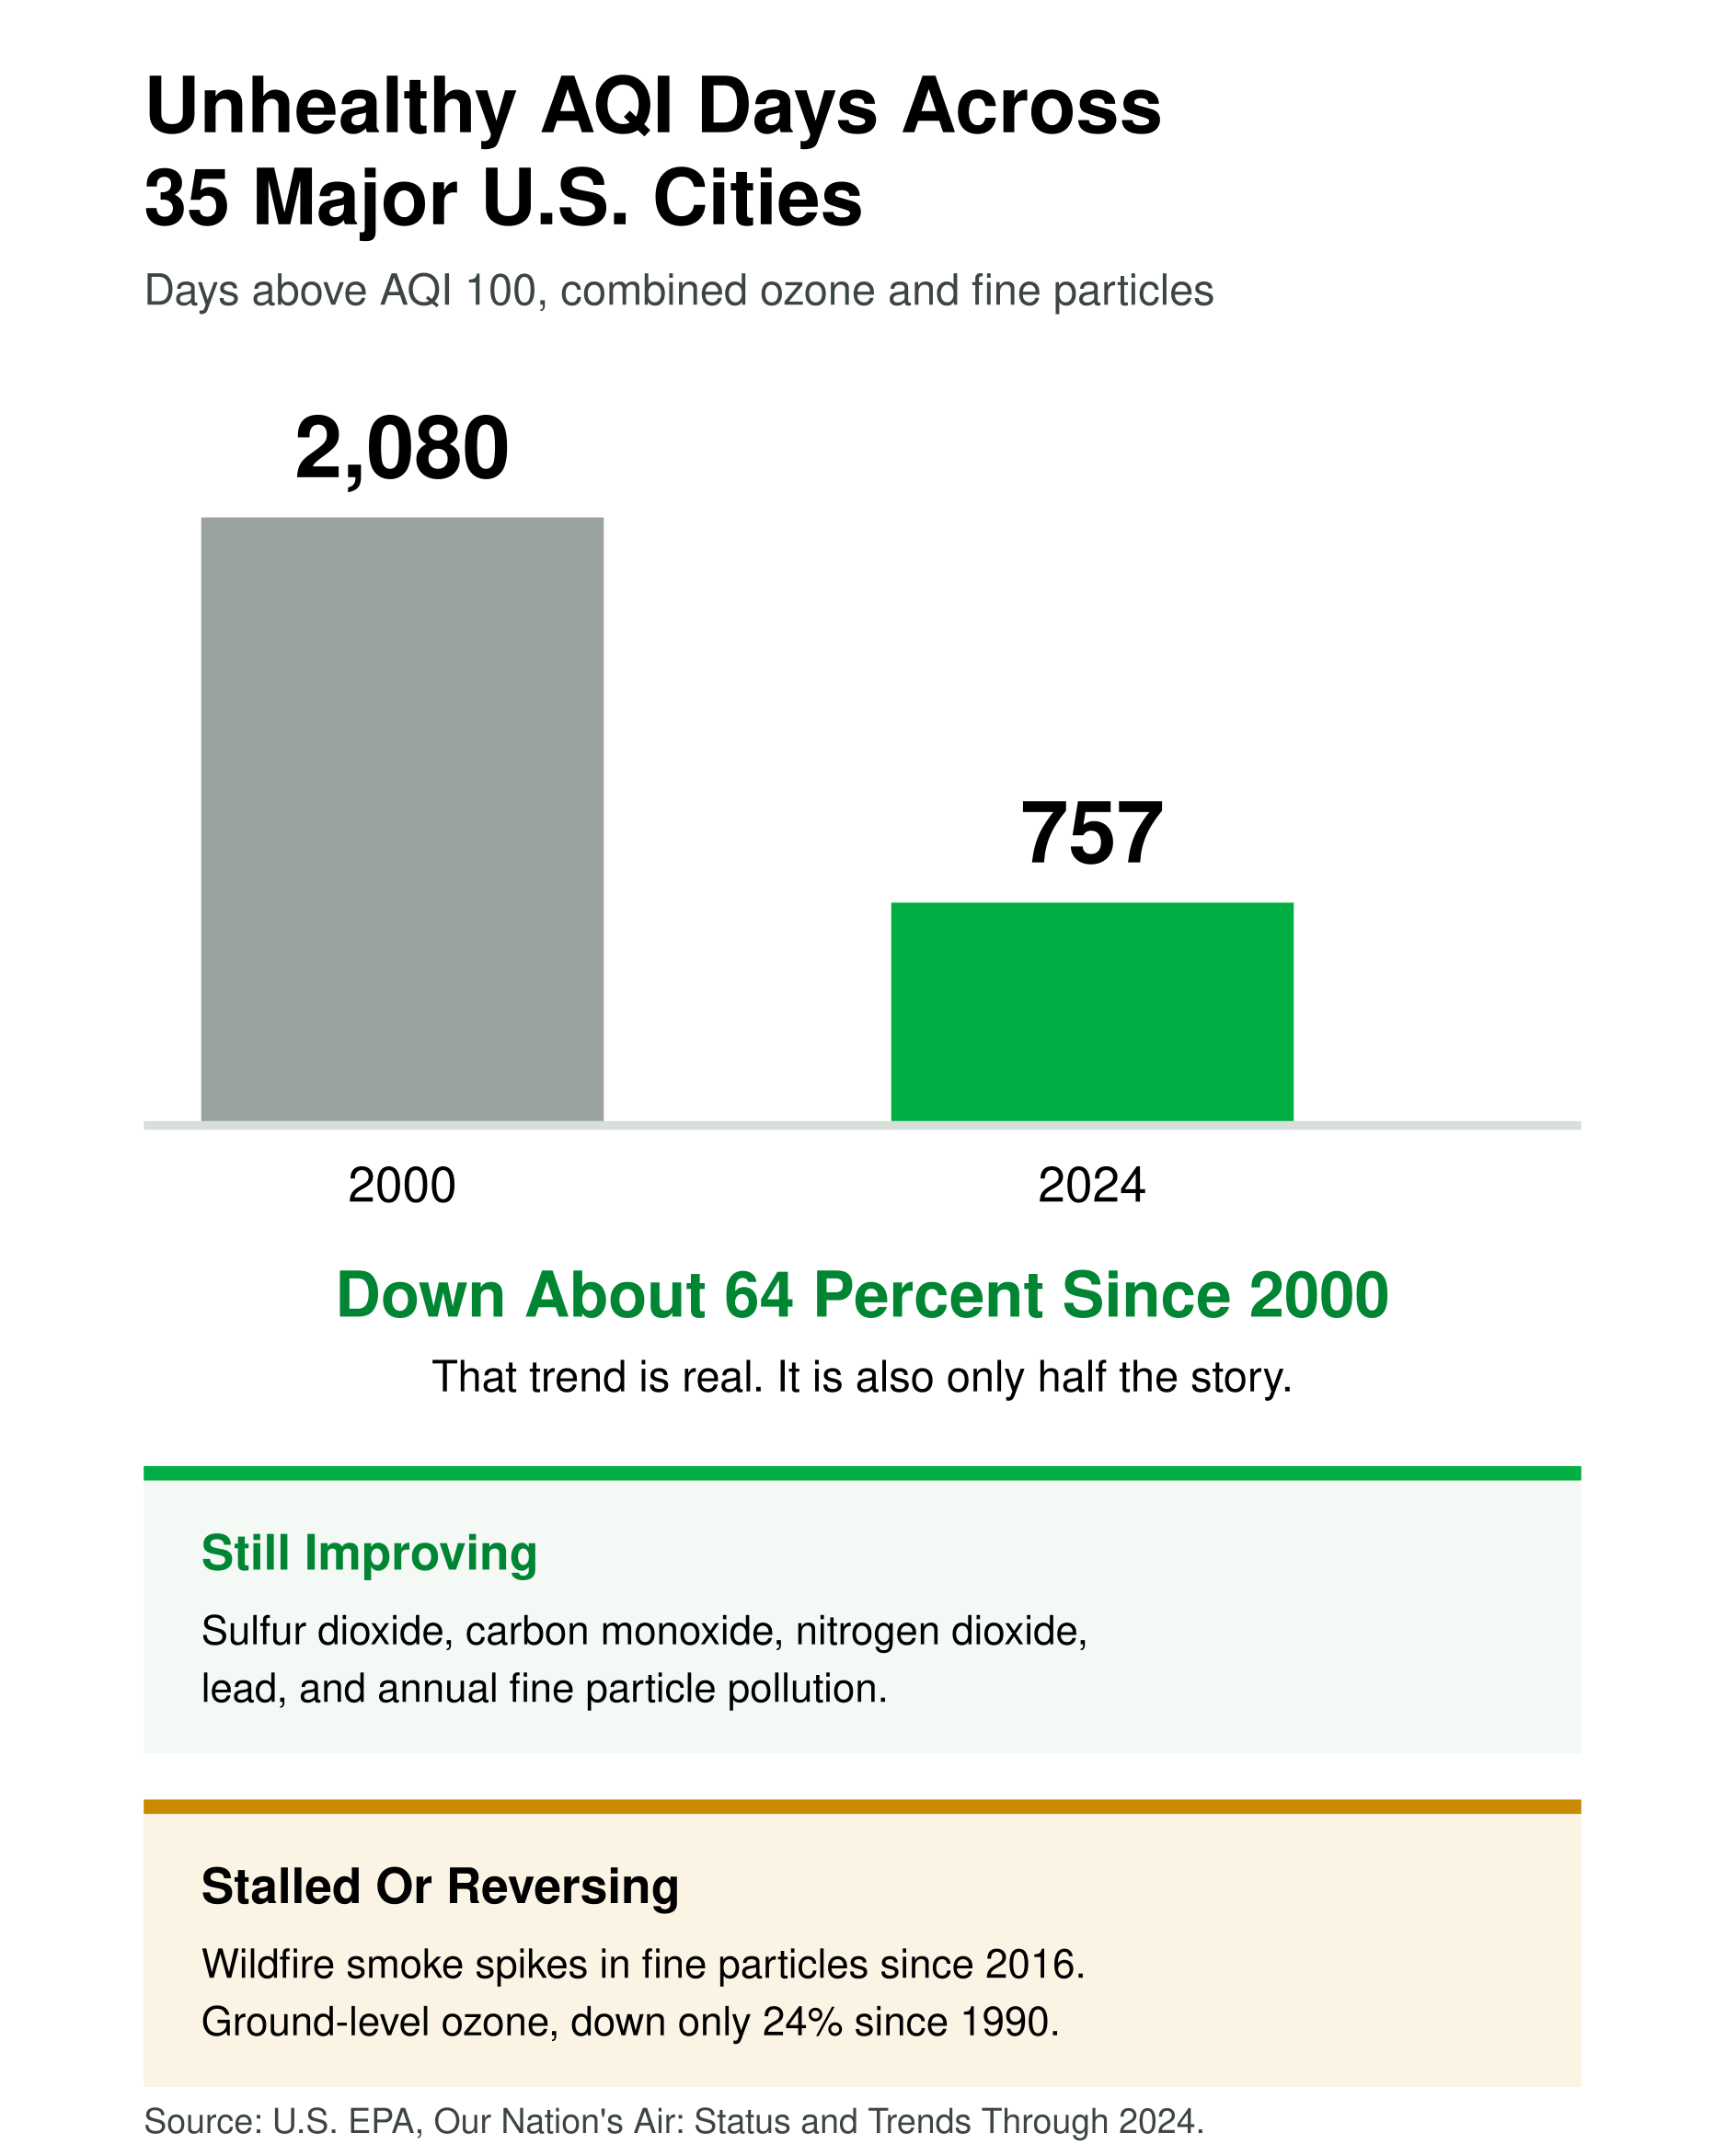
U.S. outdoor air is cleaner than it was 50 years ago, but that progress has split in two. Unhealthy AQI days across 35 major U.S. cities fell from 2,080 in 2000 to 757 in 2024, a decline of roughly 64 percent. Emissions-driven pollution keeps falling, while wildfire smoke and ground-level ozone have stalled or reversed since about 2016.
Take the quick match quiz below to find the filter that fits the air where you live, or shop Filterbuy air filters now.
MERV 13 filters capture fine particles, including wildfire smoke. Particle filters do not remove ground-level ozone, which is a gas.
Answer 3 quick questions and we'll match you to your filter.
Already know your size?
TL;DR
U.S. outdoor air is far cleaner than it was 50 years ago. Unhealthy AQI days across 35 major cities fell from 2,080 in 2000 to 757 in 2024. But that progress has split in two. Emissions-driven pollution keeps falling, while wildfire smoke and ozone have stalled or reversed since roughly 2016.
Key Takeaways
Unhealthy AQI days across 35 major U.S. cities fell from 2,080 in 2000 to 757 in 2024, a decline of roughly 64 percent (EPA, Our Nation’s Air: Trends Through 2024).
Six key pollutants fell 79 percent from 1970 to 2024, while GDP grew 338 percent.
Ozone fell only 24 percent since 1990, the slowest of the six regulated pollutants.
Wildfire smoke has eroded about 25 percent of PM2.5 progress since 2016 across nearly three-quarters of contiguous states, and more than 50 percent in many western states (Burke et al., Nature, 2023).
152.3 million Americans, 44 percent of the population, live in counties with failing grades for ozone or particle pollution (American Lung Association, State of the Air 2026).
Filterbuy has watched the divergence firsthand. Demand for higher-MERV filtration has climbed across the Midwest and Northeast every summer since 2023, even as the national trend improved.
What Does Historical AQI Data Actually Measure?
Historical AQI data measures how often outdoor air crossed a federal health threshold, not how much pollution existed in raw tons. The AQI is EPA’s 0–500 scale for ozone, particle pollution, carbon monoxide, sulfur dioxide, and nitrogen dioxide, explained in AirNow’s AQI Basics. A reading of 100 marks the short-term national standard, and trend analysis counts days above it. EPA tracks three things separately.
What historical air quality data measures
EPA tracks emissions, concentrations, and AQI days separately. They do not always move in the same direction.
Source: EPA Air Pollutant Emissions Trends Data.
Emissions can fall while AQI days rise, because weather, wildfires, and dust storms add pollution no regulation controls. That gap explains nearly every contradiction in the record, including how a national line can improve in the same year your county gets worse.
How Much Has U.S. Air Quality Improved Since 1970?
U.S. air quality improved substantially once the Clean Air Act took effect in 1970, a history our guide to how the Clean Air Act reshaped U.S. air quality covers in full. Concentrations tell the same story at street level.
Decline in national pollutant concentrations
Source: U.S. EPA, "Our Nation's Air: Status and Trends Through 2024." Ozone shown in amber as the slowest-improving criteria pollutant.
One pattern matters more than the individual numbers. Pollutants with a single identifiable source dropped fastest. Sulfur dioxide came from coal plants, so scrubbers worked. Lead came from gasoline, so pulling it from fuel worked. Ozone forms from scattered sources, so no single fix exists. That distinction predicts which problems still reach your house, and which a filter can answer.
How Many Unhealthy Air Days Does The U.S. Have Now Compared To 2000?
Unhealthy air days have fallen roughly 64 percent since 2000. EPA counts the days when combined ozone and PM2.5 hit "Unhealthy for Sensitive Groups" (orange, 101–150) or worse across 35 major cities: 2,080 in 2000 and 757 in 2024, the lowest on record.
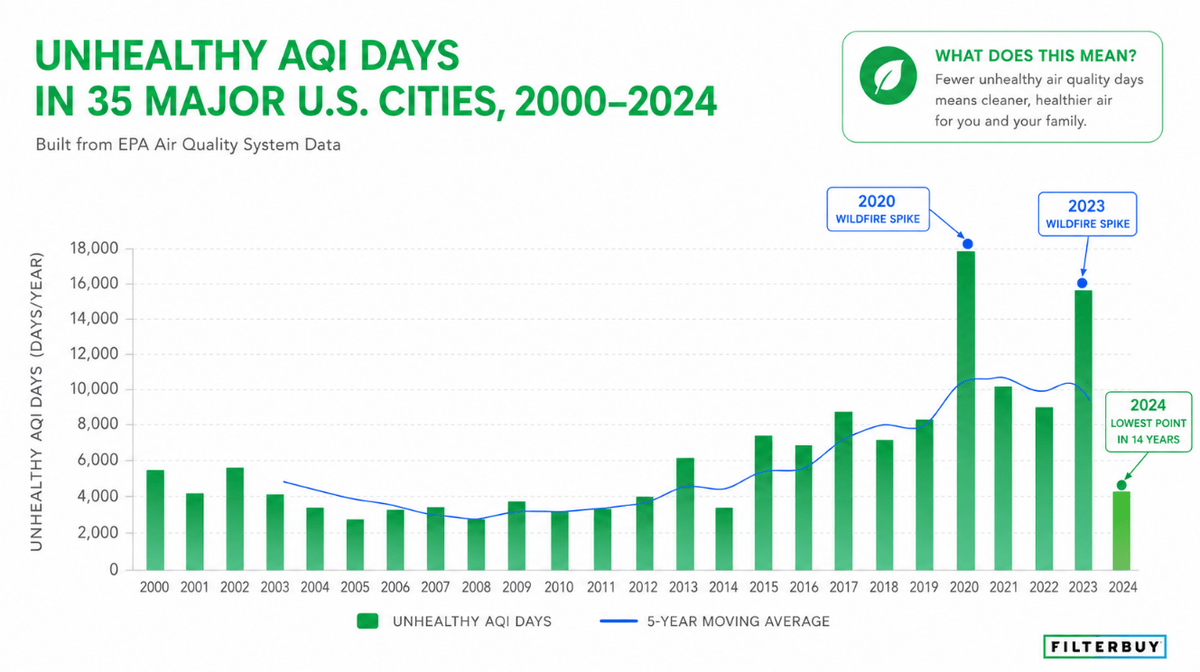
The line between those points is far from straight. Counts spike in heavy wildfire years and dip in cool, wet ones. The 2023 total rose sharply as Canadian smoke swept the Midwest and Northeast, pushing New York City and Chicago into readings most residents had never seen, then fell back in 2024. Pull your own county numbers from EPA’s Air Quality Index Report tool.
Filterbuy watches that same shape from the manufacturing side. We have been pleating filters in Talladega, Alabama for more than a decade and served over two million households. The customers who changed their buying habits after 2023 sat in the Midwest and Northeast, regions that had never treated smoke as a filter problem.
Which Air Quality Trends Are Getting Worse?
Two trends have moved the wrong way: fine particle pollution from wildfire smoke, and ground-level ozone. Both are climate-linked rather than emissions-linked, which is why tailpipe and smokestack rules have not slowed them, and why our explainer on how climate change is worsening outdoor air quality covers the pair.
Wildfire smoke has erased roughly a quarter of PM2.5 progress. A 2023 Nature study led by Marshall Burke at Stanford found that since 2016, smoke has shaped PM2.5 trends in nearly three-quarters of contiguous states, eroding about 25 percent of prior gains and over 50 percent in many western states. The worst years, 2020 and 2023, are the ones our wildfire smoke guide tracks.
Ozone progress has stalled and partly reversed. University of Iowa researchers reported in Science that fire-driven ozone rose from 2015 to 2024, offsetting roughly four years of progress and adding about 318 premature deaths a year.
More Americans are breathing failing-grade ozone than a year ago. The American Lung Association’s 27th annual report, built on 2022–2024 EPA data, found 152.3 million people in F-grade counties.
How Do Air Quality Trends Differ By Region?
Regional trends diverge enough that a national average hides them. The industrial East improved most, California holds the worst ozone, and the West and Alaska lead on particle pollution.
East: power plant controls drove the 93 percent SO₂ decline, until cross-border smoke began spiking the region every summer.
California: Los Angeles has ranked worst for ozone in 26 of 27 State of the Air reports. Basin geography drives that as much as emissions.
West and Alaska: Bakersfield has led year-round particle pollution for seven years running; Fairbanks now leads short-term spikes.
See the worst air quality cities in the U.S. and our annual city air pollution report for metro detail.
How To Read Your Own City’s Aqi History Without Being Misled
Your county record will not match the national one, and three traps distort the comparison. Filterbuy hit all three building the chart above.
The 2024 rescaling. Put 2019 and 2025 side by side and your county can look worse when the air never changed, because EPA moved the Good/Moderate line that May. Stay within one breakpoint era.
Monitor coverage shifts. EPA counts only the days a monitor actually ran, so a county that gained or lost one shows a step change that is instrumentation, not air.
Excluded smoke days. Under the Exceptional Events Rule, states can petition EPA to strike wildfire-smoke readings from compliance records, though those days still reached lungs.
Once the numbers are clean, chart days above 100 for your county rather than the annual average, then read the shape. A rising floor points to chronic pollution, while a flat floor with taller spikes points to smoke. Filterbuy treats those as separate problems, because each calls for a different response.
What Do Long-Term AQI Trends Mean For Your Home’s Air?
Outdoor trends set the baseline for whatever your HVAC system handles. Americans spend roughly 90 percent of their time indoors, where EPA finds some pollutants run 2 to 5 times higher than outside, and outdoor PM2.5 follows them in through the ordinary leaks in every house, a path we map in how outdoor air pollution enters your home. The evidence comes back to Filterbuy in returned filters, which are visibly darker after a smoke week than after a clean month. Here is how the trend translates:
What each trend means for your home
MERV 13 filters capture fine particles including wildfire smoke. No particle filter reduces ground-level ozone; activated carbon media adsorbs part of it.
The last row carries the rule that matters most. HVAC filters capture particles, not ozone. MERV 13 is tested in the 0.3 to 1.0 micron range where smoke concentrates, the size class covered in our PM10 vs. PM2.5 comparison. Against ground-level ozone it does nothing. Only activated carbon adsorbs any, and on a high-ozone day, moving plans to the morning beats a filter change.
"The falling line is the part people misread. They see unhealthy days drop by two-thirds and assume the problem closed. What the data actually shows is a floor that keeps dropping and a ceiling that keeps spiking. The spike is the week your filter has to already be in the wall."
Michelle Wan, Brand Manager and Air Quality Writer, Filterbuy
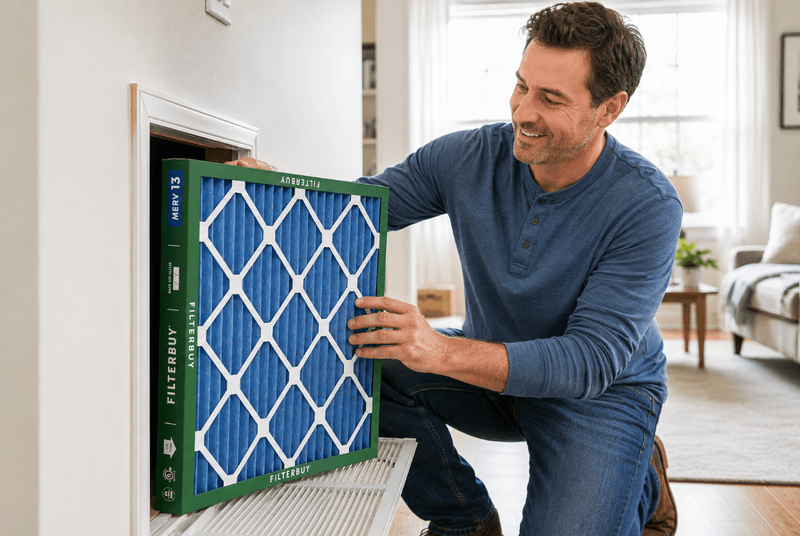
Check conditions on the live USA air quality index map, then match your filter to what you find. In a wildfire-prone region, Filterbuy MERV 13 air filters are the baseline rather than the upgrade, and our guide to which MERV rating to run when the AQI climbs walks through the thresholds.
Supporting Statistics
Three federal findings back the picture above.
230,000 early deaths prevented in 2020 alone.
Benefits beat compliance costs by over 30 to 1.
About 85 percent came from cutting fine particles.
Source: EPA’s Second Prospective Study
Asthma ER visits ran 17 percent above expected on smoke days.
A smoke day meant PM2.5 pushed the AQI past 100.
Biggest increases hit ages 5 to 64.
2026 wildfire acreage is running at 169 percent of the ten-year average.
48,960 fires have burned over 7.2 million acres.
Fire count sits at 129 percent of that average.
Source: the National Interagency Fire Center, as of August 19, 2026
Frequently Asked Questions
Where can I find historical AQI data for my city?
EPA’s AirData portal publishes county AQI reports back to 1980. For current conditions, the Filterbuy walkthrough of how to use EPA AirNow and our air quality index by ZIP code tool both pull a local reading.
Why does the AQI sometimes get worse even when emissions are falling?
Because the AQI measures what is in the air, not what is emitted. Wildfires, dust storms, inversions, and hot stagnant weather all raise concentrations regardless of industrial output. The thresholds come from EPA’s national ambient air quality standards, which is why 100 means something specific.
Does the AQI scale itself change over time?
Yes. On May 6, 2024, EPA moved the PM2.5 Good/Moderate line from 12.0 to 9.0 micrograms, per the 2024 AQI fact sheet. Read the three traps above before comparing years.
Glossary
AQI. EPA’s 0–500 Air Quality Index, from Good (0–50) to Hazardous (301+).
Clean Air Act. The 1970 U.S. federal law authorizing EPA to set outdoor air standards.
Ground-level ozone (O₃). A gas formed when nitrogen oxides and VOCs react in sunlight. Not captured by particle filters.
MERV. Minimum Efficiency Reporting Value, rating a filter’s particle capture efficiency. MERV 13 captures fine particles including smoke.
NAAQS. National Ambient Air Quality Standards, the health-based limits EPA sets.
PM2.5. Fine particulate matter 2.5 micrometers or smaller, able to reach deep lung tissue and the bloodstream.
Unhealthy for Sensitive Groups (USG). The orange AQI category, 101–150.
Exceptional Events Rule. The EPA rule letting states petition to exclude wildfire and dust-storm data from compliance records.
Sources
Filterbuy links every figure to its primary source at first mention: EPA, CDC, NIFC, Nature, Science, and the American Lung Association.