Shop by
The Air Quality Index (AQI) measures how polluted the air is and how it may affect your health.
0–50 (Good): Air quality is satisfactory.
51–100 (Moderate): Acceptable, but some pollutants may pose minor concerns.
101–150 (Unhealthy for Sensitive Groups)
151–200 (Unhealthy)
201–300 (Very Unhealthy)
301+ (Hazardous)
Still okay for most, but if you have asthma or allergies, take it easy and avoid long outdoor workouts.
Shop MERV 11 filters→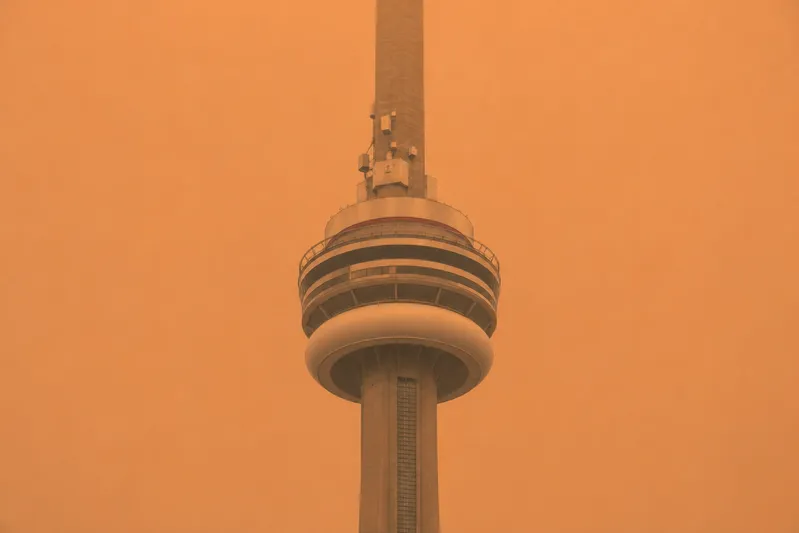
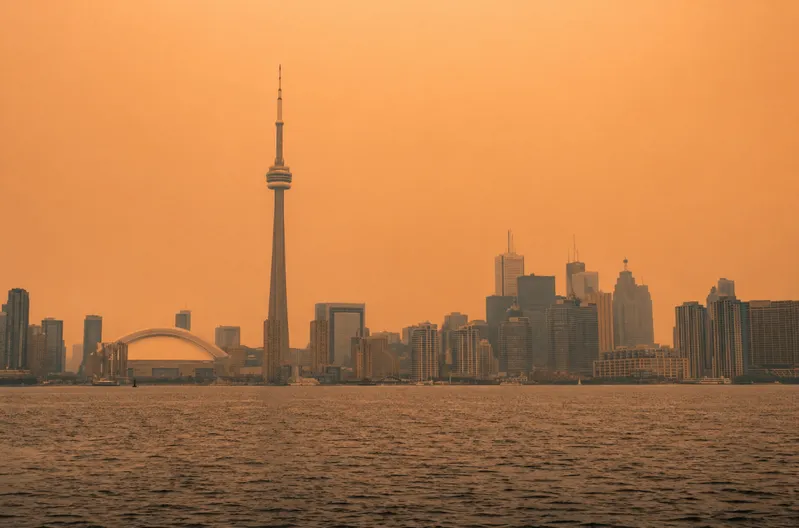
The CN Tower vanishes every summer now. The cause is wildfire smoke that's drifted across half the continent from fires nobody in Toronto heard about until the sky turned the colour of strong tea. June 2023 was the worst week so far. Toronto briefly ranked among the most polluted big metros on Earth, and the data since suggests that week won't hold the record long.
The live AQI map above shows what the air looks like right now, by neighbourhood, drawn from the official Canadian monitoring stations. Use it to plan walks, weigh whether the kids should be outside for recess, or decide if it's safe to leave a window open overnight. When the number climbs, scroll down. The rest of this page is the indoor half of the answer.
| Question | Quick Answer |
|---|---|
| Air quality in Toronto today? | Look at the live map at the top of this page. Updated hourly from the official Canadian stations. |
| AQHI vs. AQI? | AQHI is Canada's 1 to 10+ health-focused scale. AQI is the US 0 to 500 international scale. Same air, different math. |
| When is Toronto's air worst? | Summer smoke days, hot ozone afternoons, and winter inversion events in the valleys. |
| Best filter for smoke days? | A clean MERV 13 (Optimal) furnace filter , changed more often than usual during the smoke event. |
| Best filter for allergy season? | MERV 11 (Superior) captures pollen, dust mites, mould spores, and pet dander. |
| How often to change the filter? | Every 60 to 90 days is a baseline. More often during the smoke season, peak heating, or with pets in the home. |
| Indoor vs. outdoor air? | Indoor air can run 2 to 5 times more polluted than outdoor air, according to the US EPA . The HVAC filter is the front line. |
| What about HRVs? | Check the HRV or ERV filter every six months. Most homeowners forget it entirely. |
Toronto's air is good on most days but can shift within hours, especially from June through September when wildfire smoke can drift in from anywhere in the country.
Canada's official scale is the AQHI (1 to 10+). The US-style AQI (0 to 500) is the one most apps display. Both are valid descriptions of the same air, using different math.
The drivers worth knowing: wildfire smoke in summer, ground-level ozone on hot afternoons, and year-round traffic-related PM2.5 and NO₂ in any neighbourhood within 500 metres of the 401, the Gardiner, the QEW, or the DVP.
Indoor air matters more than most homeowners realise. A clean MERV 11 or MERV 13 furnace filter handles most of the particulate matter that drifts inside.
Timing matters. Buy your wildfire-season filter in spring, not on the day the sky turns yellow.
Toronto Public Health attributes roughly 1,300 premature deaths a year in the city to air pollution. The 2023 Canadian fires alone exposed 354 million people across two continents to PM2.5 above World Health Organization limits.
Toronto's air changes hour by hour. Sometimes faster than that. The map above pulls live readings from monitoring stations across the GTA, including Downtown, North York, Etobicoke West, and the wider Hamilton-Niagara airshed, then translates them into a number and a colour you can read in five seconds. Green (0 to 50) is fine. Yellow indicates moderate exposure between 51 and 100. Once a reading crosses into orange or higher, sensitive groups should ease off on outdoor exertion. That includes children, seniors, and anyone with asthma, COPD, or a heart condition. The Wikipedia entry for the Air Quality Index has the technical detail if you want it, but for the day-to-day call, the colour does most of the work.
Canada's official scale is the Air Quality Health Index (AQHI), developed jointly by Health Canada and Environment and Climate Change Canada. It runs from 1 to 10+ and combines three pollutants (ground-level ozone, nitrogen dioxide, and fine particulate matter) into one number that reflects short-term health risk.
The Air Quality Index (AQI) uses a 0 to 500 scale and comes from the US Environmental Protection Agency. Most cross-border apps default to it because more people recognise the number. Both scales describe the same air using different math. Where possible, the map above shows you both, so the translation is handled.
A handful of patterns explain most of Toronto's air quality movement through the year. From June through September, smoke from fires in Northern Ontario, Quebec, and Western Canada can reach the GTA in hours, sometimes from blazes more than a thousand kilometres away. The current live wildfire and smoke map for Canada is the fastest way to see whether plumes are approaching. On hot, sunny afternoons in summer, ground-level ozone builds up across the Windsor-Quebec Corridor, the most ozone-affected airshed in Canada. Year-round, traffic on the Gardiner, the 401, the QEW, and the Don Valley Parkway pushes PM2.5 and nitrogen dioxide higher in any neighbourhood within 500 metres of those routes.
Winter adds inversion events, when cold air settles into the Don Valley and the Rouge, trapping furnace exhaust, wood smoke, and vehicle emissions near the ground. These usually clear within a day or two. They can still push readings into the moderate or unhealthy-for-sensitive-groups range in the middle of February.
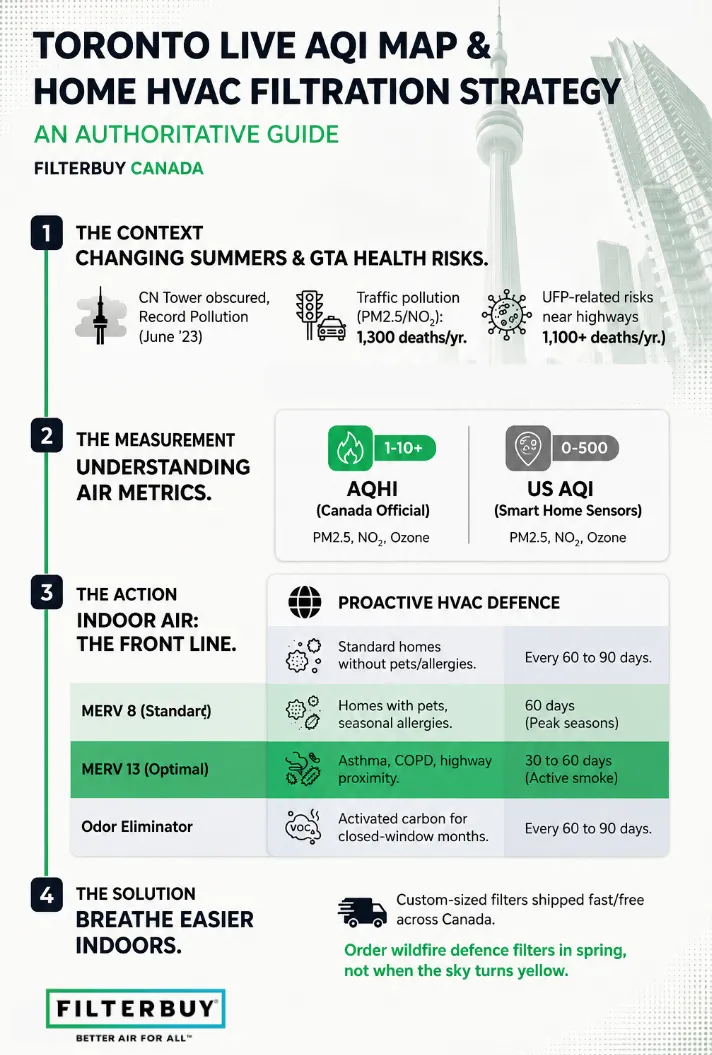
Most Toronto homeowners get the timing wrong on wildfire smoke. They wait until the sky turns yellow before swapping the filter, and by then, the furnace has been pulling smoke through a loaded filter for two days. The pattern that works is putting a fresh MERV 13 in the basement before fire season opens, not racing for the priciest filter on the shelf once smoke arrives. By that point, the priciest filter can't fix what's already been loaded into the system. Pick the right filter for your home and HVAC system, keep one spare, and change it on a schedule. That's eighty percent of the work right there.
Filterbuy Indoor Air Quality Team · Over Two Million Households Served Across North America Since 2012
No single source tells the full story. The federal AQHI readings, the provincial Ontario stations, the international data providers, and Toronto Public Health each measure or interpret things a little differently. During wildfire season, bookmark two of these and keep them open side by side. That's the fastest way to spot a discrepancy or confirm a trend.
The official Canadian Air Quality Health Index reading for Toronto, updated hourly. This is the source that the CBC, the Weather Network, and your phone's weather app are usually pulling from. It also includes a same-day and next-day AQHI forecast.
Source: weather.gc.ca/airquality/pages/onaq-001_e.html
The Ontario Ministry of the Environment, Conservation and Parks runs the provincial monitoring network that feeds most of the data on every other site listed here. Useful for station-level readings across the GTA and for confirming where the data originates.
Source: airqualityontario.com/aqhi/
Plain-language guidance on what the AQHI numbers mean for your health, broken down by risk category and population group, including children, seniors, and people with heart or lung conditions. Read it once, and the daily readings start to make a lot more sense.
Source: canada.ca/en/environment-climate-change/services/air-quality-health-index.html
International AQI provider with strong real-time visualisation and a global ranking that puts Toronto's reading in context against other cities. Combines government data with a network of citizen-operated sensors for hyperlocal coverage.
Source: iqair.com/ca/canada/ontario/toronto
Community-driven air quality network with detailed pollutant-by-pollutant breakdowns. Useful when you want to see exactly which pollutant is driving the reading, whether PM2.5, ozone, NO₂, SO₂, or CO, rather than the overall score alone.
Source: aqicn.org/city/toronto/
Toronto Public Health's resource hub for local air quality, wildfire smoke guidance, and seasonal smog alerts. Includes city-specific advice for schools, daycares, and outdoor workers when the AQHI climbs.
Source: toronto.ca/community-people/health-wellness-care/health-programs-advice/air-quality/
Weather-integrated AQI view that ties today's reading to wind direction, humidity, and incoming weather systems. Helpful for predicting how long smoke or smog will linger and when a front might clear it out.
Source: accuweather.com/en/ca/toronto/m5h/air-quality-index/55488
Air quality reads as abstract until the numbers land. These three figures, drawn from peer-reviewed research and from Toronto's own public health authority, are the ones we keep coming back to when customers ask why indoor air matters as much as the air outside.
Toronto Public Health attributes roughly 1,300 premature deaths and 3,550 hospitalisations every year to air pollution within the city, even after a decade of measurable improvement in local air quality. Traffic emissions alone account for an estimated 42 percent of those deaths. Source: Toronto Public Health, Path to Healthier Air (PDF).
A 2025 study published in Nature found that the 2023 Canadian wildfires exposed roughly 354 million people across North America and Europe to PM2.5 above World Health Organization safe limits. The researchers estimated 5,400 acute and 64,300 chronic deaths attributable to the season. The Greater Toronto Area sat inside the exposure footprint for weeks. Source: Nature, Long-range PM2.5 pollution and health impacts from the 2023 Canadian wildfires.
A 2024 McGill University study, run with Health Canada and Statistics Canada on Montreal and Toronto neighbourhood data, linked long-term exposure to ultrafine particles (UFPs) to more than 1,100 premature deaths a year. UFPs are not currently regulated in Canada. They also pass through standard furnace filters more easily than PM2.5. Source: News-Medical, Study links over 1,100 premature deaths to UFPs in Canada.
Toronto's outdoor air is, on most days, good by international standards. The AQHI sits in the low-risk band for the large majority of the year. That's worth celebrating, and worth keeping in mind when a worrying headline lands on your phone.
But the average doesn't matter as much as the worst week. June 2023 was a preview, not an outlier, and the data since has confirmed that read. Fire seasons in Western Canada and Northern Ontario keep getting longer, and the smoke now reaches the GTA regularly. The Windsor-Quebec Corridor's summer ozone problem isn't going to fix itself, and the recent McGill research on ultrafine particles suggests we've been undercounting traffic-related pollution along major GTA roads for years.
After watching how customers across North America shift their orders before and during major smoke events, our view is that indoor air protection used to be optional for most Canadian homes and isn't anymore. The good news is that the bar for meaningful protection is low. A properly sized MERV 11 or 13 furnace filter, changed on schedule, handles most of what enters the HVAC system. The work is in the planning, not the price tag.
Whatever the map says right now, four moves worth making this week will put you in a stronger position for the rest of the year.
Bookmark this page and one government source. We'd suggest the ECCC AQHI page linked above. Check both whenever the sky looks off, or your allergies flare without warning.
Look at your current furnace filter. If it's been in for more than 90 days, or it visibly looks loaded, swap it. The MERV rating is printed on the cardboard frame if you're not sure what's installed.
Order a spare filter, ideally one tier higher than what you currently run. MERV 11 (Superior) covers allergy sensitivity. Step up to MERV 13 (Optimal) if anyone in the home has asthma, COPD, or a heart condition, or if you live near a major highway or downtown.
If your home has an HRV or ERV (common in newer Ontario builds), find the filter slot and check its condition. Most homeowners forget this one entirely. Set a reminder every six months.
Today's Toronto air quality reading is shown on the live map at the top of this page. The map pulls hourly data from Environment and Climate Change Canada and Air Quality Ontario monitoring stations. On most days, Toronto reads in the Good range (AQI 0 to 50, AQHI 1 to 3) or Moderate range (AQI 51 to 100, AQHI 4 to 6). Readings climb during summer wildfire smoke events and on hot, sunny ozone days.
Open the live map above and check your neighbourhood. If the AQI is below 100 or the AQHI is 6 or lower, the air is acceptable for most outdoor activity. If the AQI sits between 101 and 150 (AQHI 7), sensitive groups, including children, seniors, and anyone with asthma, COPD, or a heart condition, should reduce prolonged outdoor exertion. Above 150 (AQHI 8 or higher), everyone should consider cutting back.
PM2.5 stands for fine particulate matter under 2.5 micrometres across. It's the pollutant most likely to drive Toronto's worst air quality days, especially during wildfire smoke and winter inversion events. The map above shows today's PM2.5 alongside the overall reading. This particle size is the one most strongly linked to short-term respiratory and cardiovascular health effects.
A handful of patterns explain most of it. Wildfire smoke from Northern Ontario, Quebec, and Western Canada drifts across the country from late spring through early autumn. Ground-level ozone forms on hot, sunny summer afternoons across the Windsor-Quebec Corridor, the most ozone-affected airshed in Canada. Year-round traffic on the 401, the Gardiner, the QEW, and the Don Valley Parkway pushes PM2.5 and nitrogen dioxide higher in nearby neighbourhoods. Winter inversion events add another layer when cold air traps emissions near the ground.
The Air Quality Health Index (AQHI) is Canada's official scale, developed by Health Canada and Environment and Climate Change Canada. It runs from 1 to 10+ and combines three pollutants (ozone, nitrogen dioxide, and fine particulate matter) into a single health-risk number. The Air Quality Index (AQI) is the US-style 0 to 500 scale used by most international apps and websites. Both scales describe the same air, with the AQHI offering more health-focused detail and the AQI being the more recognisable number across North America.
Yes, meaningfully. A clean MERV 11 (Superior) filter captures pet dander, mould spores, pollen, and a substantial share of fine particulate matter. A MERV 13 (Optimal) filter goes further and captures smoke particles and fine allergens. During smoke events, run your HVAC continuously, keep windows and exterior doors closed, change the filter more often than usual because it loads faster, and pair it with a portable HEPA purifier in the bedrooms and the room where you spend the most time.
Every 60 to 90 days is a reasonable baseline for a standard Toronto home. Change more often during wildfire smoke season (June through September), during the heaviest heating months (December through February, when Ontario furnaces run six to eight months a year), if you have pets, or if anyone in the household has asthma, allergies, or other respiratory sensitivity.
Filterbuy stocks the broadest selection of pleated air filters in North America, with over 600 sizes that include the hard-to-find ones big-box stores never carry. Every filter is quality-crafted in our own facilities, shipped free across Canada from our Toronto distribution centre at 96 Carrier Drive, and backed by over 85,000 five-star reviews. Subscribe and save means your next filter arrives when you need it, on a schedule you control. Edit, skip, or cancel anytime.
Whatever the map above is showing, the right filter on your furnace is one fewer thing to worry about the next time the wind shifts.
Find your filter size: Shop by Size on filterbuy.ca
Not sure which MERV? Most Toronto homes do well on a MERV 11. Households with asthma, allergies, or anyone living within 500 m of a major highway should consider MERV 13.
Questions? Call (855) 345-8289 (toll-free from Canada) or email info@filterbuy.com .


