Shop by
July 18, 2026
Written by Michelle Wan, Brand Manager and Air Quality Writer at Filterbuy. Reviewed by David Clark, Licensed HVAC Technician. Published/Updated July 17, 2026.
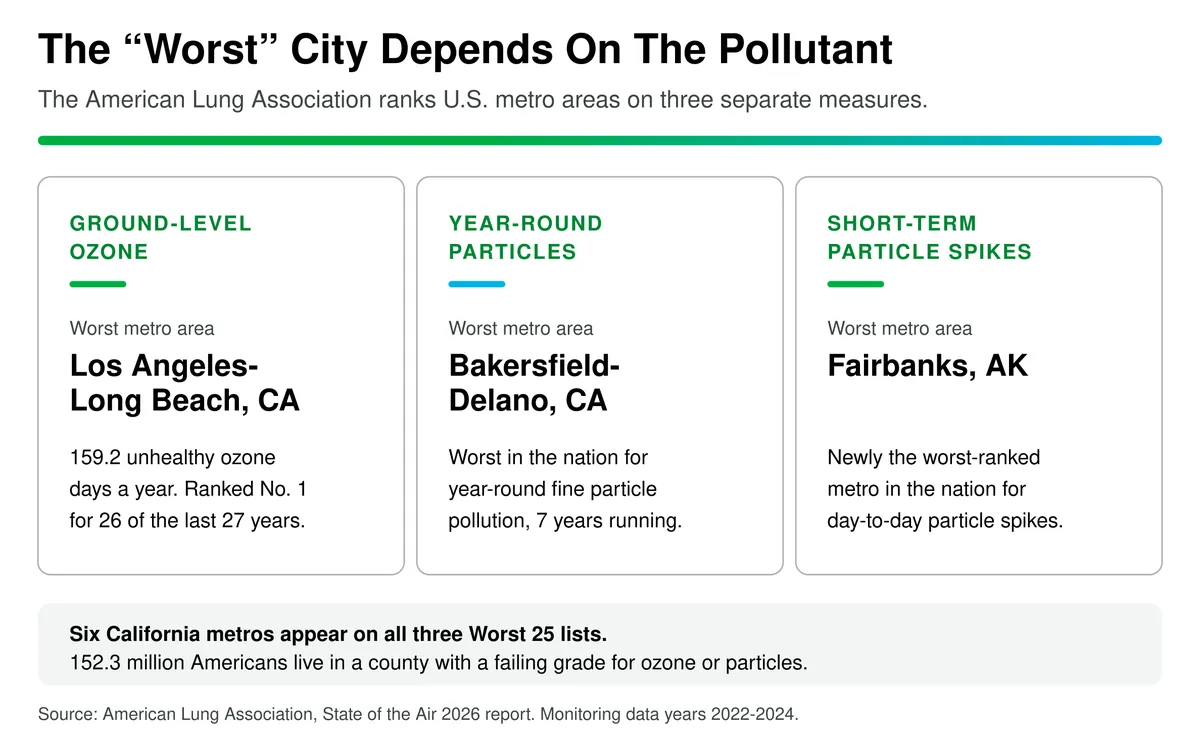
There is no single worst city — it depends on the pollutant. In the American Lung Association’s 2026 “State of the Air” report, three different metro areas sit at No. 1:
Six California metros land on all three Worst 25 lists, and 152.3 million Americans live in a county with a failing grade for ozone or particles. Outdoor air is largely outside your control; the air moving through your HVAC system is not. Take the quick match below to find the filter your system can handle, or shop air filters by size at Filterbuy.
Answer 3 quick questions and we’ll match you to the MERV rating that fits your home and your system.
Already know your size? Shop Filterbuy air filters →
Los Angeles, Bakersfield-Delano, and Visalia, California, top the American Lung Association’s 2026 "State of the Air" rankings for the worst ozone and particle pollution, with Fairbanks, Alaska, and several Texas border cities also on the worst 25 lists. Central Valley geography, heavy traffic, wildfire smoke, and a warming climate trap pollution over these regions, raising the risk of asthma, heart disease, and premature death. Checking the local AQI and upgrading to a higher-MERV filter are two direct ways to lower exposure.
Los Angeles-Long Beach remains the most ozone-polluted U.S. metro area in 2026, held 26 of the last 27 years, while Bakersfield-Delano holds the worst year-round particle ranking for a seventh straight year and Fairbanks is now worst for short-term spikes.
California’s Central Valley and Texas border metros posted the steepest particle pollution increases in the 2026 report.
152.3 million Americans, 44% of the population, live in counties with a failing grade for ozone or particle pollution, including 33.5 million children.
Wildfire smoke, vehicle and industrial emissions, basin geography, and newly flagged data center power all drive unhealthy air in these cities.
A higher-MERV Filterbuy filter can reduce the share of outdoor pollution that reaches indoor air.
The sky over Bakersfield, California, can turn a hazy brown-gray on a bad air day, and it isn’t fog. It’s fine particle pollution, and this Central Valley city has ranked as America’s most polluted metro area for year-round particle pollution seven years running, per the American Lung Association’s 2026 "State of the Air" report. Together with Los Angeles, Texas border cities, and Fairbanks, Alaska, these metro areas define what "worst air quality" looks like today.
At Filterbuy, we manufacture air filters in Talladega, Alabama, and ship them to homes across the country, including many of the metro areas ranked below. This article draws on the same public State of the Air data anyone can read, adding ground-level context for the filter in your own HVAC system.
The American Lung Association ranks metro areas separately for ground-level ozone, year-round particle pollution, and short-term particle spikes. A city can rank worst on one list and not appear on another, since the sources behind each measure differ. The rankings below reflect monitoring data from 2022 through 2024, the most recent window in the 2026 report.
Ranked by weighted average unhealthy ozone days per year.
1. Los Angeles-Long Beach, CA: 159.2 days
2. Visalia, CA: 92.7 days
3. Bakersfield-Delano, CA: 75 days
4. Phoenix-Mesa, AZ
5. Fresno-Hanford-Corcoran, CA: 54.5 days
6. Houston-Pasadena, TX: 43.3 days
7. San Diego-Chula Vista-Carlsbad, CA: 37.8 days
8. Denver-Aurora-Greeley, CO
9. Dallas-Fort Worth, TX-OK: F grade
10. El Centro, CA: 26.8 days
16. Sacramento-Roseville, CA: 16.7 days
Source: American Lung Association, State of the Air 2026 report, data years 2022 to 2024. Weighted average number of unhealthy ozone days per year. Ranks 4, 6, and 8 sourced from secondary news coverage of the ALA release, pending direct verification against the ALA table.
1. Bakersfield-Delano, CA
2. Brownsville-Harlingen-Raymondville, TX: a new worst-ever value
4. Fresno-Hanford-Corcoran, CA
5 (tie). San Diego-Chula Vista-Carlsbad, CA and Visalia, CA
7. Los Angeles-Long Beach, CA
13 (tie). San Jose-San Francisco-Oakland, CA
21. El Centro, CA
22. Dallas-Fort Worth, TX-OK
Source: American Lung Association, State of the Air 2026 report, data years 2022 to 2024. Ranked by annual average fine particle pollution.
Ranked by weighted average days per year with unhealthy fine particle spikes.
1. Fairbanks, AK: newly the worst-ranked metro area in the nation
3. Bakersfield-Delano, CA: 26.2 days
5. Visalia, CA: 19 days
6. Fresno-Hanford-Corcoran, CA: 16.5 days
7. Los Angeles-Long Beach, CA: 13 days
14. El Centro, CA: 9.2 days
20. San Francisco-Oakland-San Jose, CA: 7.3 days
Source: American Lung Association, State of the Air 2026 report, data years 2022 to 2024. Weighted average number of days per year with unhealthy short-term particle pollution spikes.
Six California metro areas appear on all three Worst 25 lists: Los Angeles-Long Beach, Bakersfield-Delano, Visalia, Fresno-Hanford-Corcoran, El Centro, and San Francisco-Oakland-San Jose. San Diego-Chula Vista-Carlsbad and Dallas-Fort Worth appear on two of the three lists, and everywhere else the problem is concentrated in a single season or pollutant.
That distinction matters for households. A city on only the short-term particle list has pollution that spikes and clears with a wildfire or weather event, while a city on all three lists doesn’t get that break.
The rankings rely on official EPA monitors, so a city with no monitor in range doesn’t appear, clean air or not.
The 2026 report covers 2022-2024, so a severe 2025 or 2026 wildfire season won’t appear until next year.
Ranking well on one list doesn’t guarantee clean air on every measure. Sacramento-Roseville makes the ozone list but not either particle list.
Use the local AQI resources below to check current conditions instead of relying on an annual ranking.
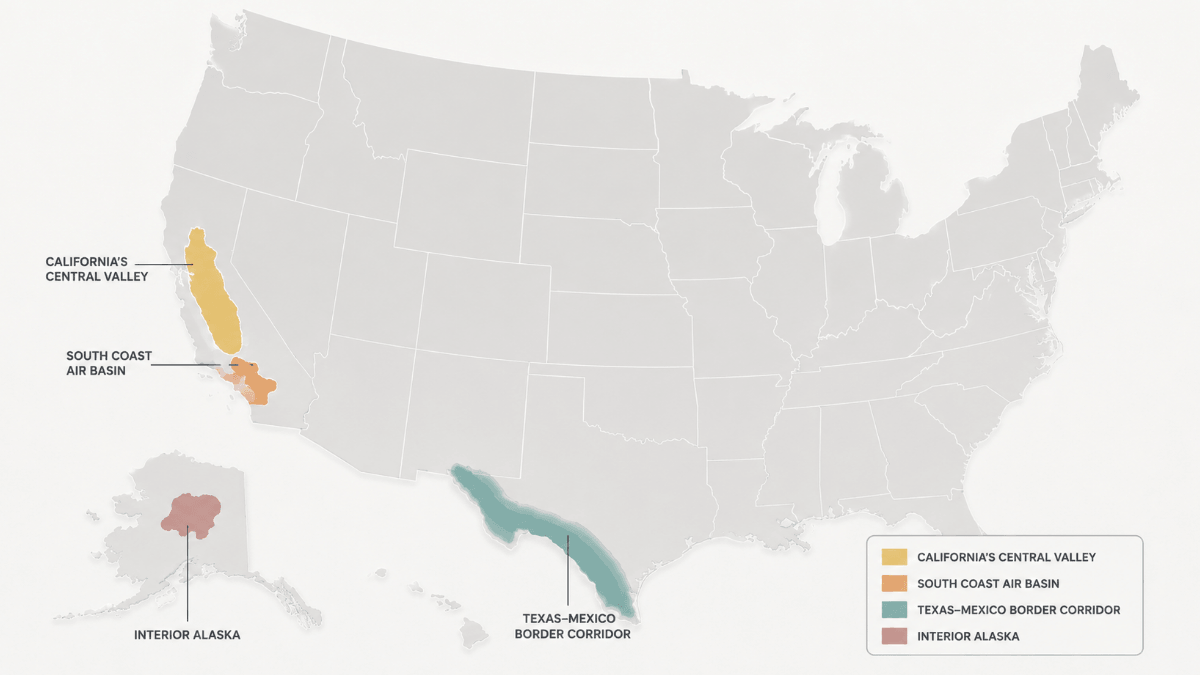
Geography and emissions stack the odds against these metro areas year after year. Bakersfield, Visalia, and Fresno sit in California’s Central Valley, a flat basin ringed by mountains that traps vehicle exhaust and agricultural and diesel freight emissions close to the ground. Los Angeles faces the same problem in its coastal basin, where mountains hold pollution while sunlight turns emissions into ozone. Dense traffic, port activity, and warehousing around Los Angeles and the Texas border metros add the compounds that form ozone and fine particles.
Canadian wildfire smoke pushed ozone and particle pollution higher across dozens of central and eastern states in the 2026 report, on top of the smoke that regularly affects the West. The report also flags a new concern for the first time: emissions from fossil fuel and backup generator power some data centers rely on. Hotter, drier conditions raise both high-ozone days and wildfire risk, making it harder for cities to hold on to past gains.
Ground-level ozone irritates the lungs on contact, an effect researchers compare to a sunburn on lung tissue, triggering coughing, shortness of breath, and asthma attacks, with repeated exposure causing lasting damage.
Fine particle pollution, or PM2.5, is small enough to bypass the body’s defenses and reach the lungs or bloodstream, raising the risk of heart attacks, stroke, lung cancer, premature death, and low birth weight. Children, older adults, pregnant people, outdoor workers, and anyone with asthma, COPD, or heart disease face the greatest risk, and people of color and lower-income households are disproportionately likely to live in failing-grade counties.
Outdoor air quality is largely outside a household’s control, but the air inside a home is not.
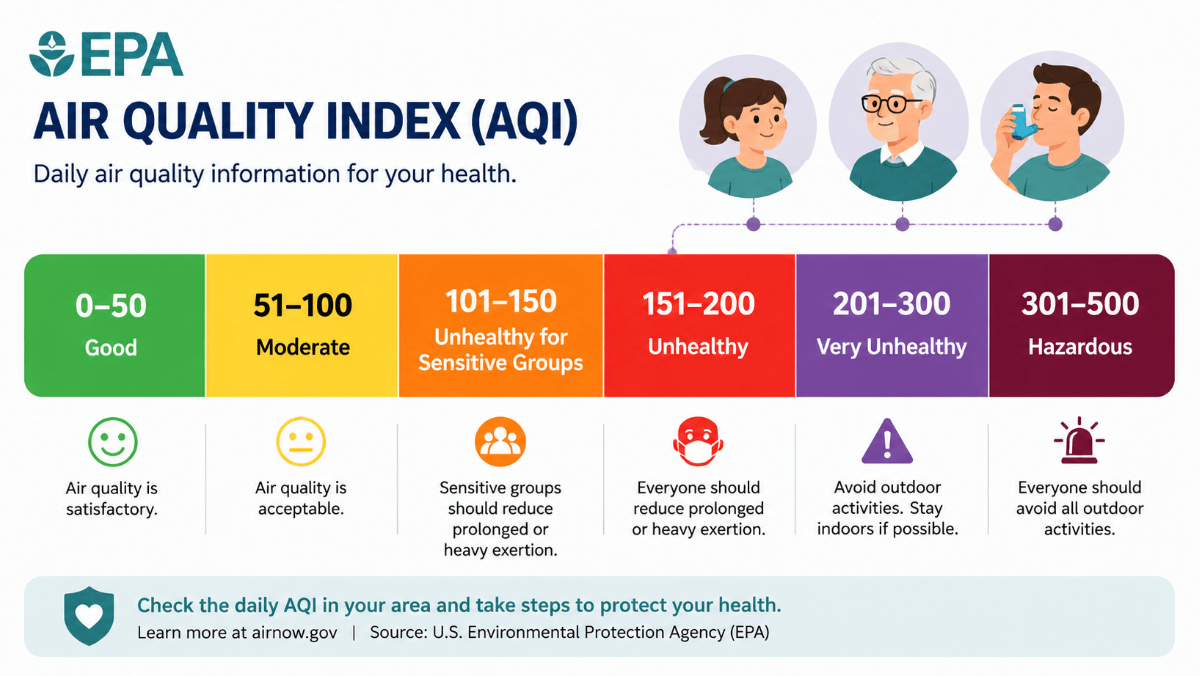
Check the local AQI before extended time outdoors, and treat an orange, red, purple, or maroon rating as a signal to limit strenuous activity.
Keep windows and doors closed on unhealthy air days, and run the HVAC fan to circulate air through the filter rather than relying on outdoor air.
Choose the highest-MERV filter the HVAC system can handle without restricting airflow. ASHRAE recommends MERV 13 where supported, since higher ratings capture more fine particles. Filterbuy makes filters in over 600 sizes.
Replace filters on schedule. A clogged filter stops protecting a home’s air once it can no longer pull air through cleanly.
David Heacock, Founder and CEO of Filterbuy, says: "After manufacturing filters for over a decade and serving more than two million households, from the Central Valley to the Gulf Coast, households in cities like Bakersfield and Los Angeles ask the most detailed questions, from how often to change a filter to what to do when the AQI reads unhealthy three days in a row. Our answer doesn’t change. Filter what you can control, keep it clean, and don’t wait for wildfire season to find out what your HVAC system can handle."
Filter-replacement frequency is one of the most common questions Filterbuy hears from customers in high-pollution metro areas. A bad air season can cut a filter’s useful life roughly in half, so a filter in these cities is worth checking monthly instead of waiting for the usual 60 to 90 day reminder.
Each resource below serves a different purpose, from today’s AQI to the health science behind it.
The American Lung Association’s State of the Air 2026 report is the primary source behind every ranking here, with the complete Worst 25 lists for all three measures.
AirNow.gov is the EPA’s official tool for current, hour-by-hour AQI readings across the country.
The CDC’s air pollutants overview breaks down which conditions each pollutant worsens.
EPA’s National Ambient Air Quality Standards page explains the legal limits behind a failing grade in reports like State of the Air.
NOAA’s satellite-based wildfire smoke tracking shows how far smoke plumes travel and affect air quality far from the source.
NIEHS’s air pollution and health research summary gathers federally funded studies linking pollution to chronic disease.
The San Joaquin Valley Air Pollution Control District’s daily forecast covers Bakersfield, Fresno, Visalia, and the valley.
Three more data points back up the claims above, each from a distinct .gov or .org source.
Source: U.S. Census Bureau, Characteristics of New Housing, up from 86% in 2000. Nearly every new home now depends on its central HVAC filter to clean circulating air.
Source: Asthma and Allergy Foundation of America, Air Pollution and Asthma. Ozone and particle pollution are documented asthma triggers, making this population most at risk from the pollution levels above.
Source: American Heart Association, Air Pollution, Heart Disease and Stroke. Also linked to stroke, arrhythmia, and heart failure, with risk highest for older adults and those with existing heart conditions.
It depends on the pollutant. Los Angeles-Long Beach ranks worst for ozone in the 2026 "State of the Air" report, Bakersfield-Delano ranks worst for particle pollution, and Fairbanks ranks worst for short-term particle spikes.
California’s Central Valley and South Coast basins are ringed by mountains that trap emissions close to the ground, and abundant sunlight speeds the reaction that forms ground-level ozone.
Check the local AQI, limit strenuous activity when it reads orange or higher, keep windows closed, and run the HVAC system with a clean, rated filter.
A higher-MERV HVAC filter captures a meaningful share of fine particles drifting indoors from outdoor smoke, though it cannot replace outdoor improvements. Filterbuy’s MERV 11-13 filters are built for this load.
AQI: EPA’s 0-500 scale for daily outdoor air pollution and health risk. Above 100, air quality is unhealthy, first for sensitive groups and then for everyone as the number climbs.
MERV: ASHRAE’s 1-16 scale rating how well an HVAC filter captures particles, with higher numbers meaning finer filtration.
