Shop by
June 18, 2026
The air quality index looks like one tidy number on your phone. Behind it, the EPA has already run a separate calculation for every pollutant in your air, then handed you only the worst result. Get that worst-pollutant rule, and the rest of the formula falls into place.
We have spent years obsessed with what is actually floating through the air people breathe, and this number is where that story starts for most families. Learn how it gets built, and you take back a little control over the air around the people you love.
The EPA scores each pollutant on its own, using that pollutant's breakpoints and one formula.
The highest single score becomes your AQI.
That pollutant gets called the dominant pollutant.
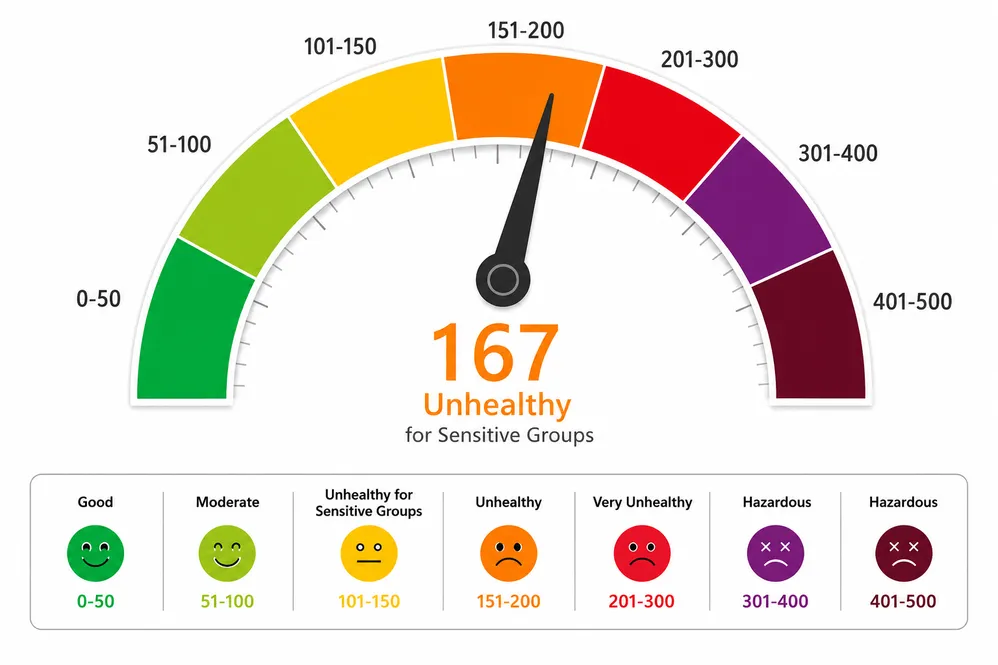
The scale runs from 0 to 500 across six categories, Good to Hazardous.
PM2.5 breakpoints changed in May 2024, so check your numbers against the current set.
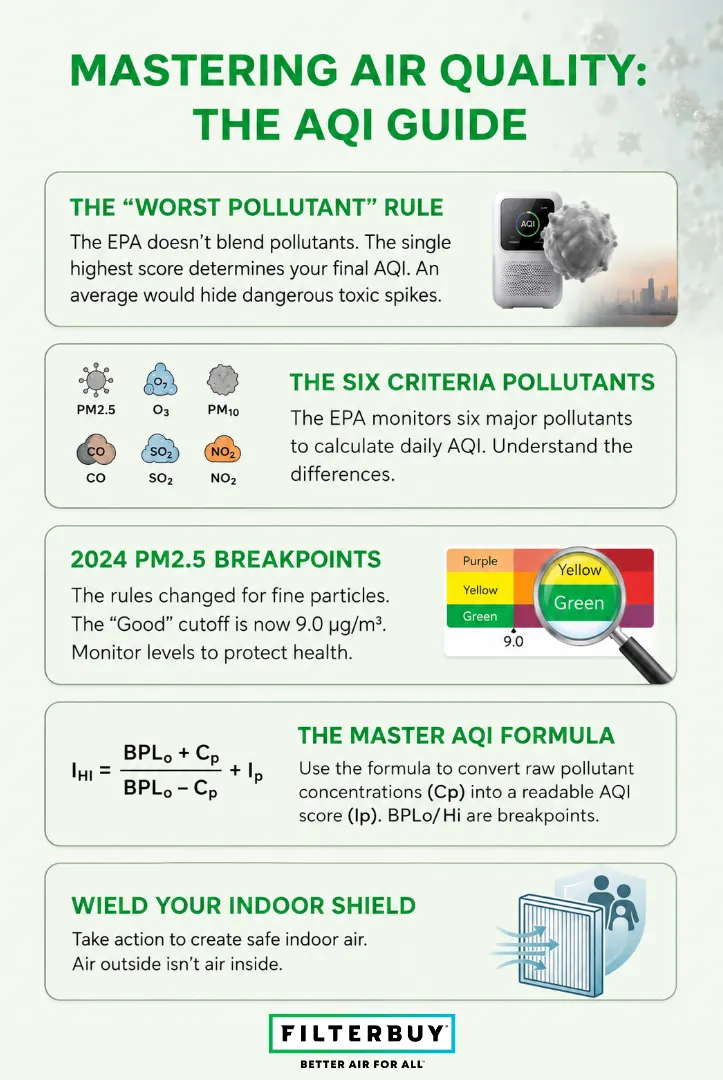
Worst Air, Not Average. The AQI shows your single most dangerous pollutant, never a blend of all of them.
One Formula, Every Pollutant. Each one runs through the same equation. The highest score wins and becomes the dominant pollutant.
PM2.5 Usually Decides It. Fine particles set most readings, and the Good cutoff dropped from 12.0 to 9.0 micrograms in May 2024, so old charts are wrong.
It Only Measures Outdoor Air. Indoors, your filter decides what your family breathes.
Check It Daily. Glance at AirNow each morning. Head out when it is low, shut the windows, and let your system filter when it climbs.
The AQI runs from 0 to 500 and sorts your air into six color-coded categories, climbing from Good all the way to Hazardous. Fifty or below means clean air. Anything above 300 is genuinely dangerous, the kind of day you keep the kids inside.
If the basics are still fuzzy, our guide to what the air quality index is walks through the categories and what each one means for your health.
The Clean Air Act puts six pollutants on the index: fine particulate matter (PM2.5), coarse particulate matter (PM10), ground-level ozone (O3), carbon monoxide (CO), sulfur dioxide (SO2), and nitrogen dioxide (NO2). On most days in most neighborhoods, one of them wins. Fine particles set the number you see, because they slip past your defenses, travel deep into your lungs, and reach your bloodstream.
The EPA leans on a single equation, run once per pollutant, and while it looks intimidating on the page, the thinking behind it is simple.
Ip = ((IHi − ILo) / (BPHi − BPLo)) × (Cp − BPLo) + ILo
Ip is the sub-index you are solving for, the AQI score for one pollutant.
Cp is what the monitor measured for that pollutant, trimmed to a set number of decimals.
BPLo and BPHi are the breakpoints sitting just below and just above your reading.
ILo and IHi are the AQI values tied to those two breakpoints.
Picture a sliding scale between two fixed posts. The formula finds where your reading sits between the breakpoint below it and the one above, then reads off the matching AQI. Same logic as pricing tiers. Once you know the tier, you know roughly where the score lands.
Breakpoints are the cutoffs that pin each category to a real-world concentration. The EPA sets them so that an AQI of 100 lines up with a pollutant's short-term national health standard. Cross that line and the air shifts from acceptable into territory that starts hurting sensitive groups, people with asthma, children, and older adults.
The index goes back to the 1970s, and the story of how the air quality index developed worldwide is worth a look if you like the backstory.
This is where a lot of older articles quietly go wrong. In May 2024, the EPA tightened the PM2.5 breakpoints to match newer health research. The Good-air cutoff dropped from 12.0 to 9.0 micrograms per cubic meter, and the EPA rescaled the upper categories, too. If a page still quotes 12.0, it is feeding you a stale number.
Here are the cutoffs the EPA uses today for 24-hour PM2.5, in micrograms per cubic meter.
| AQI Category (Index Value) | PM2.5 Range (µg/m³) | Color Code |
|---|---|---|
| Good (0 to 50) | 0.0 to 9.0 | Green |
| Moderate (51 to 100) | 9.1 to 35.4 | Yellow |
| Unhealthy for Sensitive Groups (101 to 150) | 35.5 to 55.4 | Orange |
| Unhealthy (151 to 200) | 55.5 to 125.4 | Red |
| Very Unhealthy (201 to 300) | 125.5 to 225.4 | Purple |
| Hazardous (301 to 500) | 225.5 to 325.4 | Maroon |
Source: U.S. EPA, 2024 Air Quality Index update for particulate matter.
Let's run a real one. Say a monitor reads a 24-hour PM2.5 concentration of 30.0 micrograms per cubic meter.
That 30.0 lands in the Moderate band, so BPLo is 9.1, BPHi is 35.4, ILo is 51, and IHi is 100.
Drop those into the formula: ( (100 - 51) / (35.4 - 9.1) ) x (30.0 - 9.1) + 51.
The division comes out near 1.86, times 20.9 gives about 39, and adding 51 lands you at roughly 90.
So the PM2.5 sub-index is about 90.
If nothing else scores higher that day, 90 is your AQI, the air sits in Moderate, and PM2.5 takes the title of dominant pollutant.
An average would feel fair, and it would also be dangerous. Lump six pollutants together, and a few clean readings can hide one toxic spike. So the EPA reports the single highest sub-index instead, because your air is only as safe as its worst part. The worst offender gets a name, the dominant pollutant, and on smoky or smoggy days, it is almost always fine particles or ozone.
None of this math runs until a monitor measures the air first. Then the EPA truncates the reading, dropping the extra decimals instead of rounding them. The EPA cuts ozone to three decimal places, PM2.5 and carbon monoxide to one, and PM10, nitrogen dioxide, and sulfur dioxide down to whole numbers. The formula uses that trimmed value, never the raw one.
Air quality can swing fast, and wildfire season is the proof. To keep the live reading honest, the EPA runs a weighted average called the NowCast for ozone and particle pollution. When conditions change quickly, the NowCast leans on the most recent hours, so the number on your phone keeps up instead of lagging a full day behind.
Here is what reaches you. The EPA scores every pollutant a monitor tracks, compares the scores, and pushes the highest one to AirNow and every app that pulls from it. So the number you check before a run, or before cracking a window, is really a stand-in for the worst air that the monitor saw.
After manufacturing filters for over a decade and serving more than two million households, we have learned that the AQI number on your phone only describes the air outside. The moment that air comes indoors, the filter in your system decides how much of it your family actually breathes.
— Filterbuy Team
You already understand more about the air around you than most people ever will, and the right sources keep that edge sharp. We pulled together the references our own air-obsessed team trusts, so you can check the math, follow the latest standards, and protect your family with confidence.
When you want to check the work yourself, this is where the experts keep the receipts. The EPA and AirNow lay out the full equation, every pollutant's breakpoint table, and the NowCast method, so nothing about your AQI stays hidden.
Source: AirNow Technical Assistance Document
Every cutoff in the index traces back to a health standard, and this table shows you which one. Knowing that a score of 100 marks a pollutant's legal limit turns the AQI from a guess into something you can read with confidence.
Source: EPA NAAQS Table
Air science keeps moving, and so do we. This 2024 rule documents the tighter 9.0 threshold for clean air and the rescaled upper categories, so you can spot outdated advice the moment you see the old 12.0 figure.
Source: Federal Register 2024 final rule
Reading the number is step one. Acting on it is where you protect the people you love. The CDC spells out what each color means for sensitive groups and the simple moves that keep your family breathing easier.
Source: CDC air pollutants overview
On most days, invisible fine particles called PM2.5 decide your reading, and this guide shows where they come from and how far into your body they travel. It is the clearest look at the threat you cannot see floating through your air.
Source: American Lung Association particle pollution guide
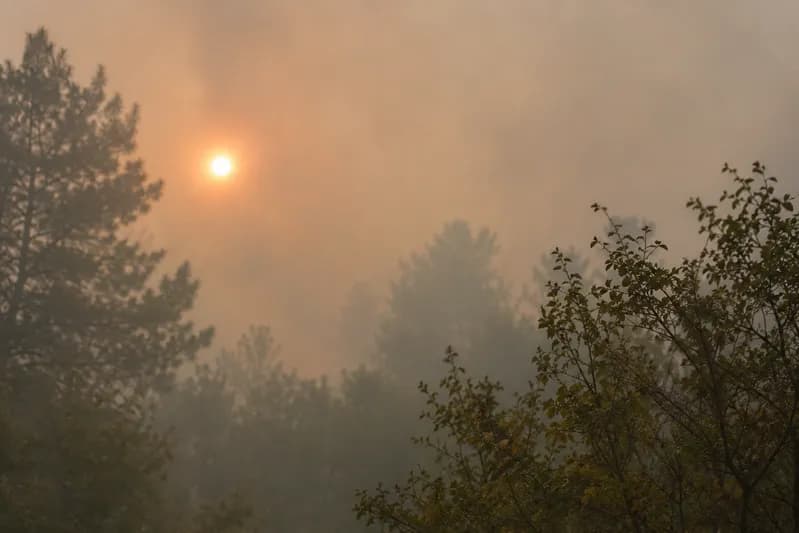
When wildfire smoke rolls in, those fine particles spike, and your reading can climb overnight. Forest Service researchers track how that smoke forms and moves, which helps you make sense of the days your air turns dangerous fast.
Source: U.S. Forest Service smoke research
Ground monitors cannot sit on every corner, so NASA watches particle pollution from orbit to fill the gaps. It widens your view from a single sensor to the whole sky, showing the air patterns moving toward your home.
Source: NASA particulate matter observations
We do not ask you to take our word for any of this. These come straight from the agencies that monitor and report your air.
The official U.S. AQI reaches you through AirNow, a partnership of the EPA, NOAA, the National Park Service, NASA, and the CDC, plus state, local, and tribal agencies. Source: NOAA AirNow monitoring overview
Federal monitoring networks like IMPROVE measure fine particle pollution and visibility at sites across the country, feeding the readings into the index runs. Source: National Park Service air quality monitoring
People move between outdoor and indoor air all day, and the air inside a home can carry higher pollutant levels than the air outside. Source: NIEHS indoor air research
Once you can read the number, you can do something about it. The smartest move on a high-AQI day is the air you actually control, which is the air inside your home. A fresh, well-rated filter grabs the fine particles that sneak indoors, so your family breathes easier even when the sky outside turns orange.
You are the one looking out for your household, and every choice about your indoor air adds up to protection for the people you love.
You cracked the formula. Now make it work for your family.
Check The AQI Each Morning. Pull it up on AirNow or your weather app. Note the dominant pollutant.
Match Plans To The Category. Good or Moderate, head out. Orange or higher, ease off hard outdoor exertion, especially for children, older adults, and anyone with asthma.
Seal Off Indoor Air On Bad Days. Keep windows shut. Run your HVAC so it keeps filtering.
Upgrade Your Filter. Check your size. Swap in a higher-rated filter before the next smoke event.
Set A Replacement Reminder. Change it on schedule. Change it more often in wildfire season.
Keep Learning. Bookmark the sources above and fact-check any claim you run into.
Every step puts more clean air between the outside world and the people you love.
How is the air quality index calculated?
The EPA scores each pollutant it monitors on its own, using that pollutant's breakpoint table and one linear formula, then reports the single highest score as the AQI.
What is the AQI formula?
The formula is Ip = ( (IHi - ILo) / (BPHi - BPLo) ) x (Cp - BPLo) + ILo, where Cp is the truncated pollutant concentration and the breakpoint values bracket that reading.
What are the EPA AQI breakpoints?
Breakpoints are the concentration cutoffs that define each category. For PM2.5 in 2024, Good runs from 0.0 to 9.0 micrograms per cubic meter, Moderate from 9.1 to 35.4, and the scale climbs to Hazardous at 325.4.
Why does the AQI use the worst pollutant instead of an average?
An average would let clean readings hide one dangerous pollutant. The highest sub-index keeps the warning honest, since your air is only as safe as its worst part.
Did the PM2.5 AQI breakpoints change in 2024?
Yes. On May 6, 2024, the EPA dropped the Good ceiling from 12.0 to 9.0 micrograms per cubic meter and rescaled the upper categories to match newer health research.
How is AQI determined during wildfire smoke?
During smoke events, the EPA uses the NowCast weighted average for particle pollution, leaning on the most recent hours so the reported AQI keeps pace with fast-changing conditions.
Now that you know exactly how the air quality index is calculated, you can see that the number only ever describes the air outside your front door. Put a higher-rated Filterbuy filter to work, and the air your family actually breathes stays clean no matter what today's reading says.